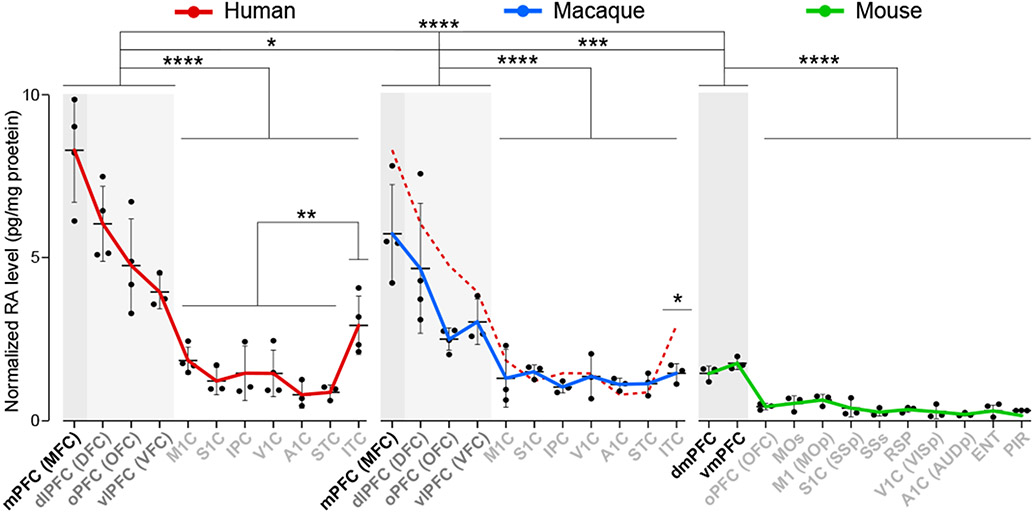
Fig. 2 ∣. PFC-enriched antero-posterior gradient of RA.
a, RA concentrations in human (PCW 16, 18, 19, 21) and macaque (Four PCD 110 brains), and mouse (Four PD 1 brains) (N = 3-4 for each areal sample) cortical areas. One-way ANOVA with post-hoc Dunnett’s adjustment or two-tailed unpaired t-test: ****P < 1e-4, ***P=0.0005, (Macaque PFC vs. Mouse PFC), **P = 0.005 (Human non-PFC minus ITC vs. Human ITC) *P = 0.01 (Human PFC vs. Macaque PFC), P = 0.04 (Human ITC vs. Macaque ITC); Errors bars: S.E.M. Dashed red line in macaque graph represent human RA concentrations. Single assay was done for each brain sample.

