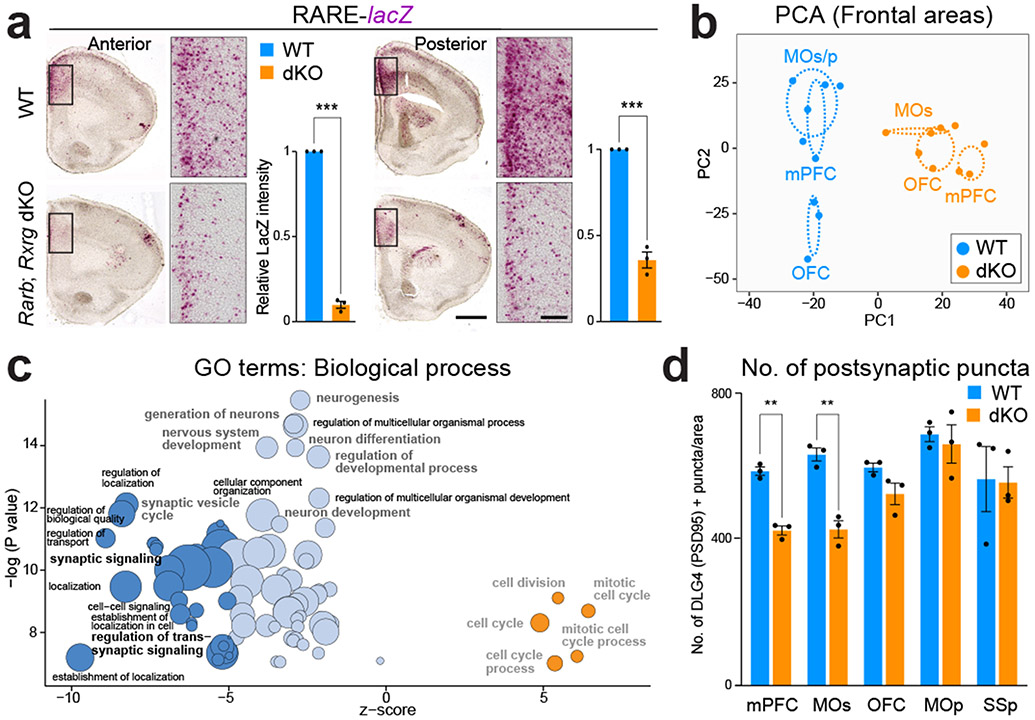
Fig. 3 ∣. Reduced RA signaling in the PFC of mice lacking Rxrg and Rarb leads to downregulation of genes involved in synapse and axon development.
a, β-Galactosidase histochemical staining in Rxrg +/+;Rarb +/+; (WT); RARE-lacZ (Blue) and Rxrg −/−;Rarb −/− (dKO); RARE-lacZ (orange) brains at PD 0. Two-tailed Student’s t-test: WT vs. dKO: ***P =1e-6; 3e-4, Errors bars: S.E.M.; N = 3 per genotype; Scale bars: 200 μm; 50 μm (inset). b, First, two principal components calculated from the expression of DEx protein-coding genes between WT and dKO littermates in at least one of the three frontal cortex areas (mPFC, MOs, and OFC). c, GO terms associated with DEx genes showing their z-score and unadjusted p values. Z-score represents the proportion of upregulated versus downregulated genes in the dKO compared to WT associated to each GO term. Dark blue: z-score < −5; light blue: z-score −5,0; orange: z-score >0. Size of the bubbles are proportional to the total number of DEx genes associated to the given GO term. d, Quantification of excitatory synapses marked by DLG4/PSD95 in the mPFC, MOs, OFC, MOp, and SSp regions from PD 0 WT and dKO mice brains. Two-tailed Student’s t-test: **P = 6e-4; 2e-3; Errors bars; S.E.M.; N = 3 per genotype. For reproducibility information, see Methods.

