
Fig. 4 |. Increased density of dendritic spines in the mPFC of humanized CBLN2 E2 mice.
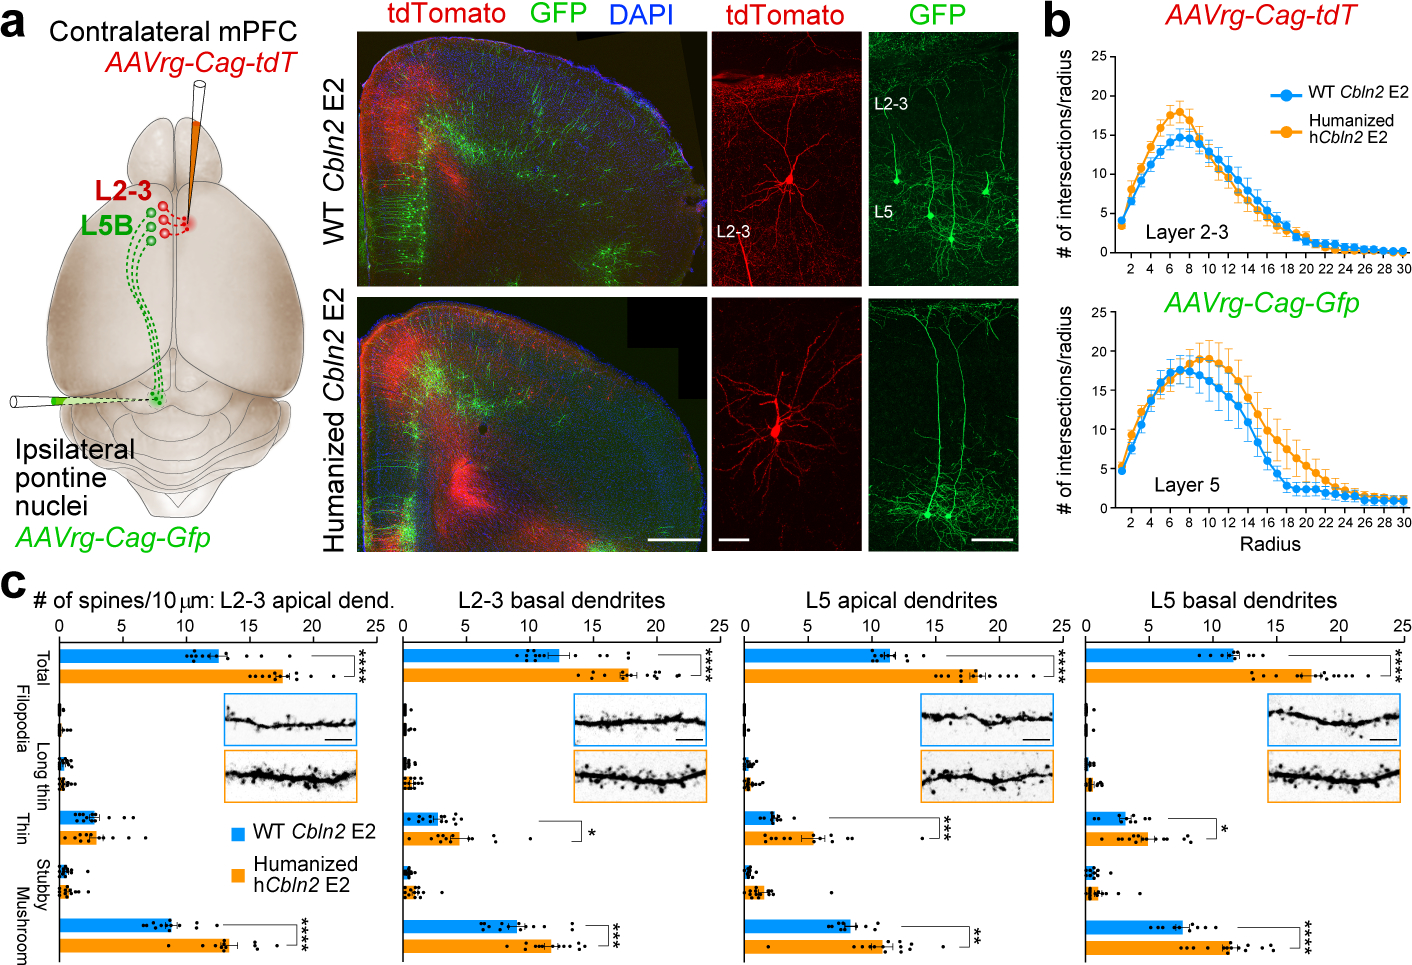
a, Retrogradely labeled callosal L2-3 (red; AAVrg-Cag-tdT) and subcerebral L5B (green; AAVrg-Cag-Gfp) PD 60 pyramidal neurons. Scale bars, 500 μm (left); 20 μm (right). Three brains from each genotype were injected. b, Sholl analysis of retrogradely labelled L2-3 (top) and L5 (below). Two-way ANOVA with Sidak’s multiple comparison method. Error bars: S.E.M.; N = 13 (WT Cbln2 E2), and 15 (hCbln2 E2) L2-3; N = 11 (WT Cbln2 E2), and 15 (hCbln2 E2) L5 (N = 3 brains per genotype). c, Quantification of dendritic spines. Two-way ANOVA with Sidak’s multiple comparison method; *P = 0.03 (L2-3 basal dendrites), 0.03 (L5 basal dendrites); **P = 5e-3, ***P = 4e-4 (L2-3 basal dendrites), 4e-4 (L5 apical dendrites); ****P < 5e-5; Error bars: S.E.M.; N = 13 (WT Cbln2 E2), and 12 (hCbln2 E2) L2-3 apical dendrites; N = 14 (WT Cbln2 E2) and N = 15 (hCbln2 E2) L2-3 basal dendrites; N = 10 (WT Cbln2 E2), and 14 (hCbln2 E2) L5 apical dendrites; N = 10 (WT Cbln2 E2) and N = 15 (hCbln2 E2) L5 basal dendrites (N = 3). Scale bar, 10 μm.