Fig. 6.
Association of Mfn2 with PINK1/Parkin Mitophagy Pathway Regulators is Reduced by Phosphorylated Cav-1.
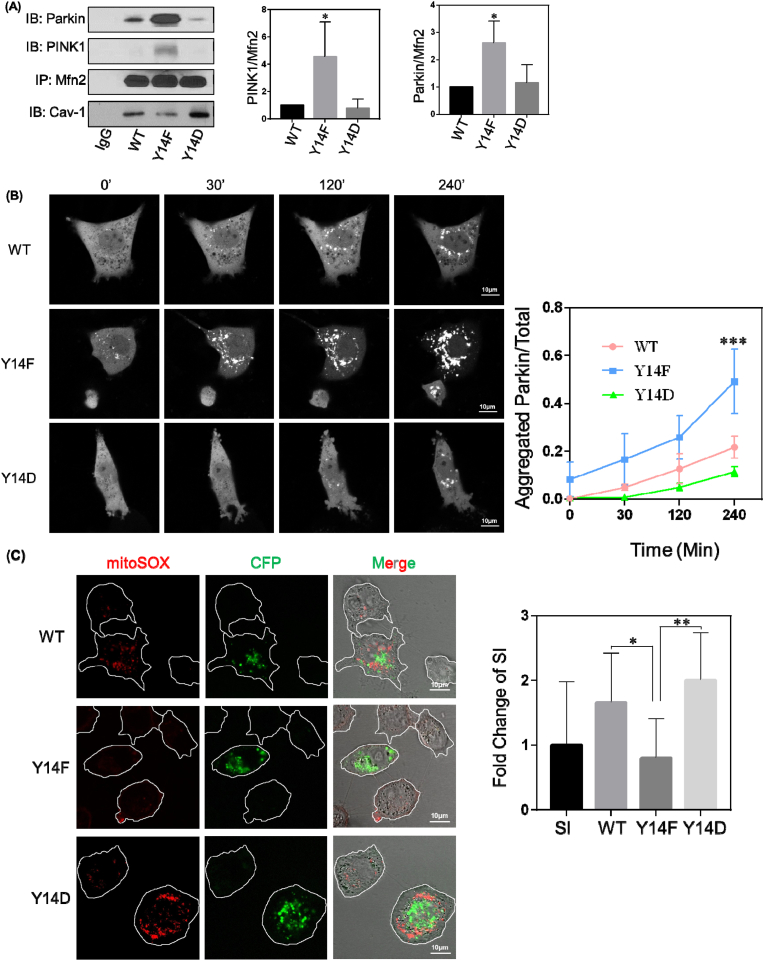
(A) Cav-1 depleted MDA-MB-231 cells were transfected with Cav-1 wildtype (WT), Y14F, and Y14D mutants, and after 48 h lysed and immunoprecipitated with anti-Mfn2 monoclonal antibody. Bar graph depicts increase in PINK1 and Parkin binding to non-phosphorylated Cav-1 relative to WT and Y14D Cav-1. Data are mean ± SEM, n = 3; *p < 0.05 vs WT by ANOVA.
(B) Cav-1 depleted MDA-MB-231 cells were co-transfected with Cav-1 WT, Y14F, Y14D mutants and Parkin-GFP. After 48 h, cells were treated with 4 μM antimycin and 10 μM oligomycin for up to 4 h and Parkin localization was visualized by confocal microscopy. The ratio of aggregated fluorescent signal relative to total GFP fluorescence was calculated to assess mitochondrial recruitment of Parkin over time. Cells expressing Cav-1 phosphorylation deficient Y14F mutant showed greater aggregated Parkin indicating increased mitochondrial recruitment. Data are mean ± SEM, n ≥ 6; ***p < 0.001 vs WT by ANOVA.
(C) Representative images of MitoSOX staining in Cav-1 depleted cells which were transfected with Cav-1 WT, Y14F or Y14D CFP-tagged mutants. Bar graph depicts fold change of fluorescence intensity normalized to non-transfected Cav-1 depleted cells which were used as internal controls. Data are mean ± SEM, 12 ≤ n ≤ 15; *p < 0.05, **p < 0.01 by ANOVA.
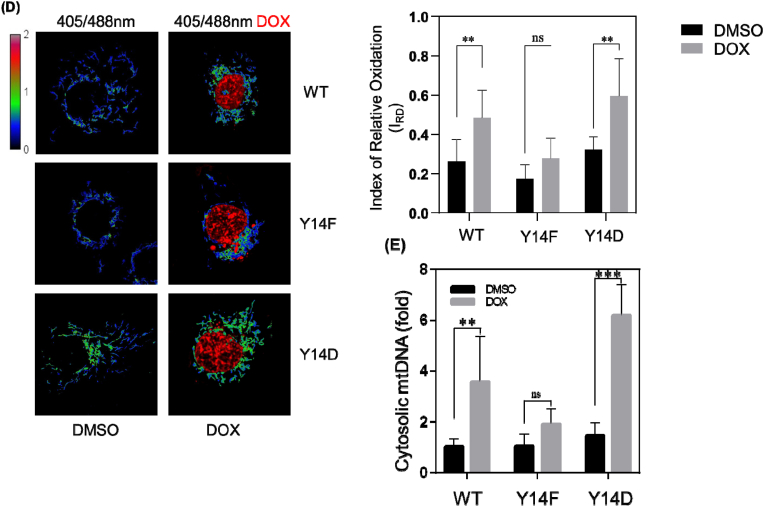
(D) Cav-1 depleted cells expressing mito-roGFP2-ORP1 were transfected with Cav-1 mutants and then treated with DMSO or 10 μM doxorubicin for 4 h. Mitochondrial oxidation was measured based on the ratio of emitted roGFP fluorescence at alternating 405 vs 488 nm excitation. Y14F mutant inhibited mtROS production whereas WT and Y14D increased mtROS particularly after doxorubicin treatment. Data are mean ± SEM, n = 10; **p < 0.01 by ANOVA.
(E) Cav-1 mutant expressing cells were treated with DMSO or 10 μM doxorubicin for 24 h. Cytosolic fractions were then collected and analyzed by RT-PCR. Bar graph summarizes the fold change in mtDNA in the cytosol normalized to WT Cav-1 expressing cells treated with DMSO. Mitochondrial DNA in the cytosol was significantly increased by Y14D mutant suggesting phosphorylation of Cav-1 inhibits mitochondrial repair. Data are mean ± SEM, n = 3; **p < 0.01, ***p < 0.001 by ANOVA. (For interpretation of the references to colour in this figure legend, the reader is referred to the Web version of this article.)


