Figure 1.

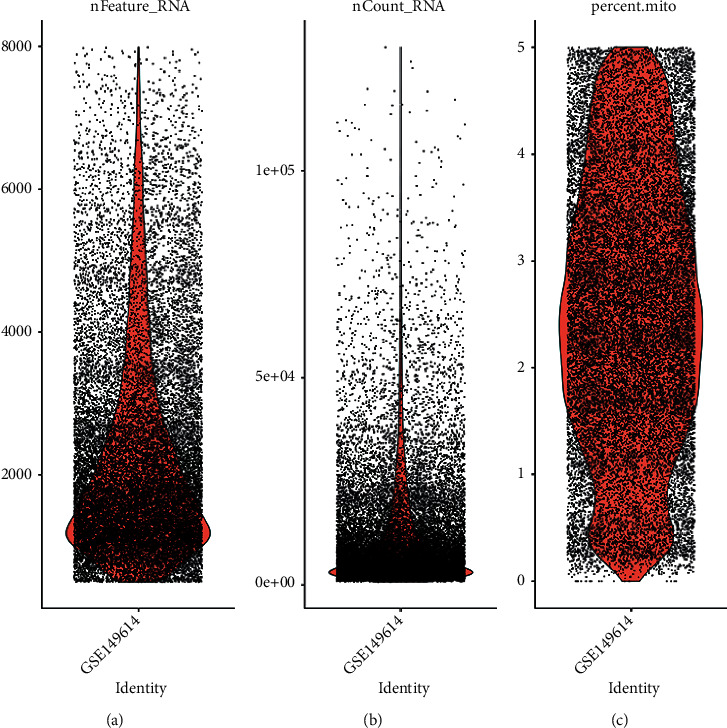
Quality control chart of GSE149614 single-cell data set. (a) The number of genes in a cell. (b) Count distribution of genes. (c) Figure: mitochondria percentage.

Quality control chart of GSE149614 single-cell data set. (a) The number of genes in a cell. (b) Count distribution of genes. (c) Figure: mitochondria percentage.