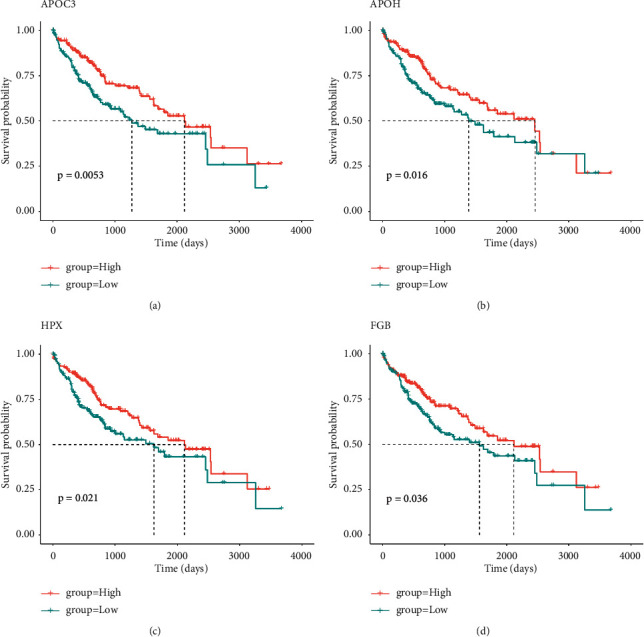
Figure 11.

Hub gene survival analysis. (a) KM curve of APOC3 high- and low-expression groups. (b) KM curve of APOH high- and low-expression groups. (c) KM curve of HPX high- and low-expression groups. (d) KM curve of FGB high- and low-expression groups.
