Figure 5.

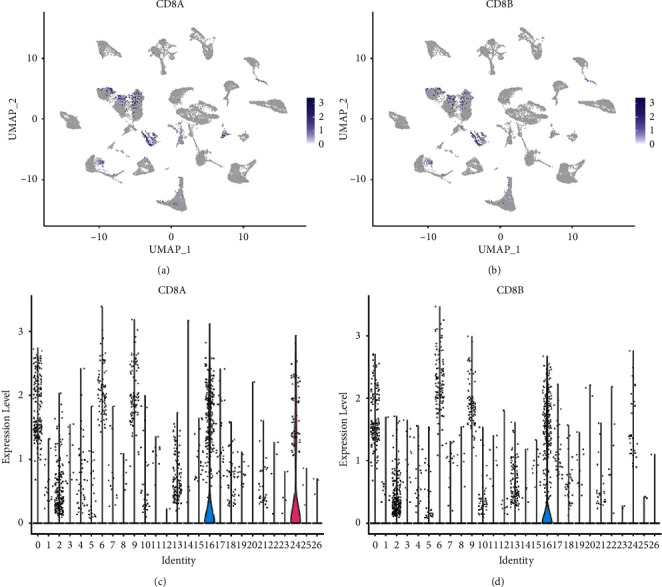
Expression and distribution of CD8+ T cell markers. (a, c) Expression distribution of CD8A. The darker the color, the higher the expression. (b, d) Expression distribution of CD8B.

Expression and distribution of CD8+ T cell markers. (a, c) Expression distribution of CD8A. The darker the color, the higher the expression. (b, d) Expression distribution of CD8B.