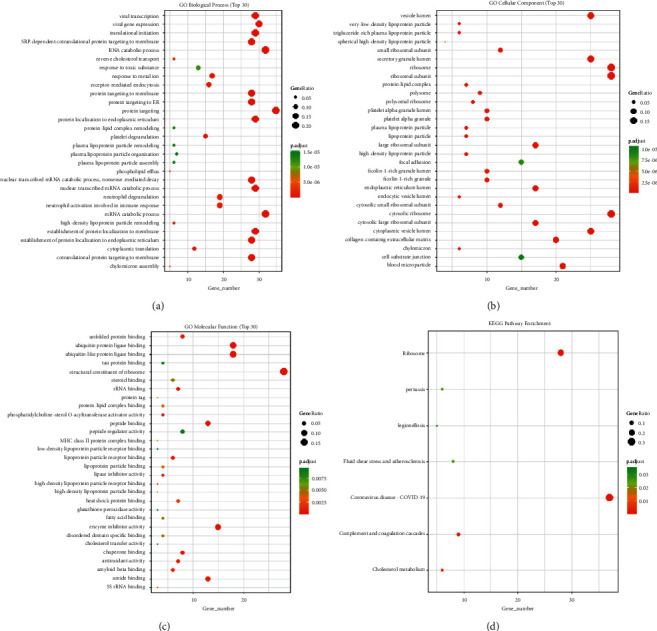
Figure 7.

GO and KEGG enrichment analysis of the cytotoxic CD8 T cells 4 subgroup. (a) GO enrichment of biological process. (b) GO enrichment of cellular component. (c) GO enrichment of molecular function. (d) Enrichment of KEGG pathway. The vertical axis represents the enrichment items, the horizontal axis represents the number of different genes in the enrichment items, the size of the dot represents the ratio of the number of different genes in the enrichment items to the number of background genes, and the color represents the BH-corrected P value. The red color is directly proportional to enrichment.
