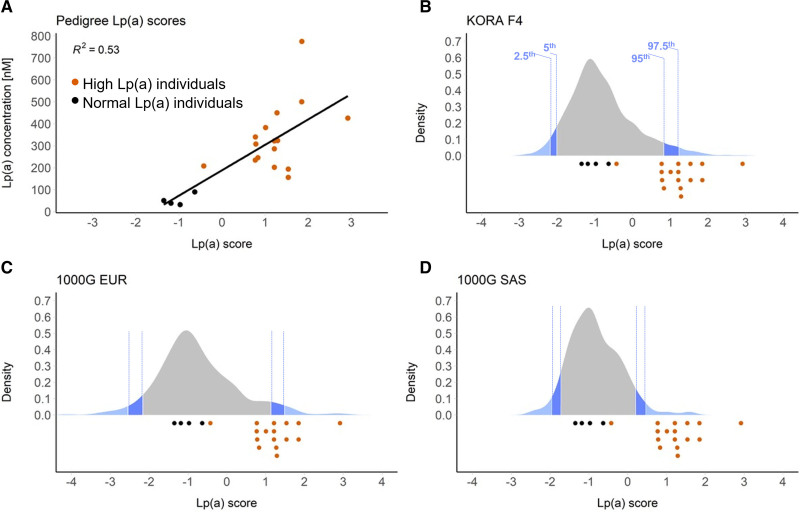
Figure 2.
Lp(a) (lipoprotein [a]) genetic risk scores. A, Correlation between the Lp(a) Genetic risk scores (GRS) and Lp(a) plasma concentrations in family members with high (orange dots) and normal (black dots) Lp(a) levels. B, Distribution of LPA GRS in the general KORA F4 reference population. C, Distribution of Lp(a) GRS of the 1000 Genomes European (EUR) continental group. D, Distribution of Lp(a) GRS of the 1000 Genomes South Asian (SAS) continental group. Dark and light blue areas indicate bottom/top 5th and 2.5th percentiles, respectively. Lp(a) GRS of family members with high and normal Lp(a) levels (assessed in plasma samples three times in three independent experiments) are indicated by orange and black dots below each chart, respectively. For Lp(a) GRS, the effects of the 48 genome-wide significant single nucleotide polymorphisms (SNPs) were used. They represent 2001 genome-wide significant SNPs in a 1.76 Mb large region spanning LPA locus.

