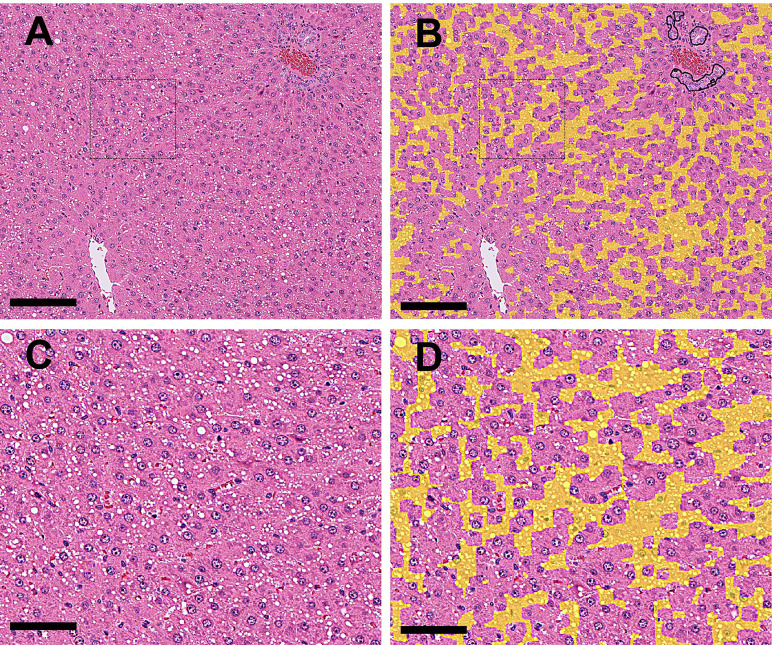
Fig. 3.
A: (Original WSI): Vacuolation (drug-induced) at the periportal area to the midzonal and normal bile ducts within the Glisson’s sheath were observed. B: (Annotation by the algorithm): The abnormal area (vacuolation) in Fig. 3A was annotated (filled) with yellow. (Bar=200 μm). C: Higher magnification of the dashed area in Fig. 3A. D: Higher magnification of the dashed area in Fig. 3B. The abnormal area (vacuolation) in Fig. 3C is annotated (filled) with yellow (Bar=100 μm).

