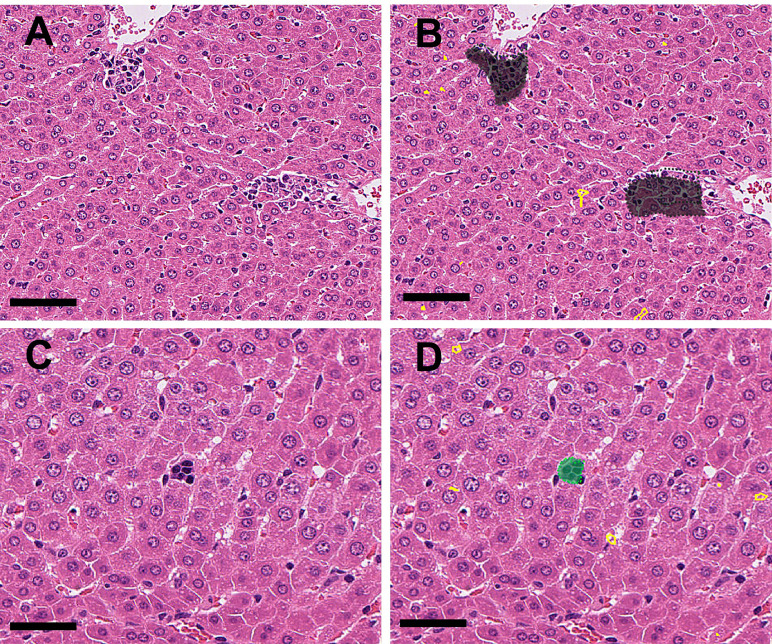
Fig. 7.
A: (Original WSI): Microgranuloma (spontaneous) near central veins were observed. B: (Annotation by the algorithm): The abnormal area (microgranuloma) in Fig. 7A was annotated with gray (Bar=100 μm). C: An erythroblastic island (spontaneous) was observed in the sinusoids. D: The abnormal area (extramedullary hematopoiesis) in Fig. 7C is annotated as green (Bar=50 μm).

