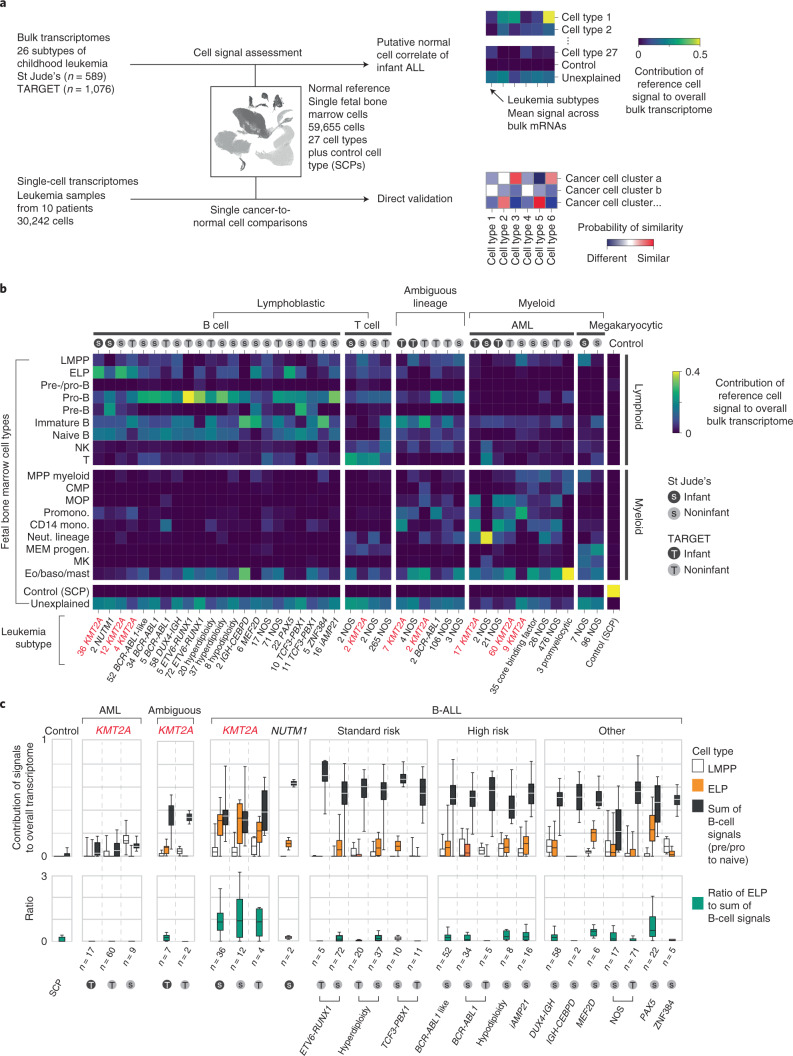
Fig. 1. Cell signal analysis of 1,665 leukemia transcriptomes reveals an ELP state in KMT2A-rearranged B-ALL.
a, Schematic overview of the study approach. We assessed the differentiation state of KMT2A-rearranged infant ALL by measuring signals of human fetal bone marrow cell types across the entire spectrum of childhood leukemia in data derived from two different cohorts (St Jude’s and TARGET). We then validated cell signals by single-cell mRNA sequencing for direct comparison of cancer and normal cells. b, Heatmap showing mean cell signals of human fetal bone marrow cells (y axis) in human leukemia bulk transcriptomes subdivided by genetic subtype (see labels underneath, KMT2A rearrangements shown in red text), age (gray circle, infant; black circle, noninfant) and source (S, St Jude’s; T, TARGET). Numbers next to labels refer to case load per subtype. Subtypes with only one case were excluded from analysis. baso, basophil; CMP, common myeloid progenitor; Eo, eosinophil; LMPP, lymphoid-primed multipotent progenitor; MEM progen., ; MK, megakaryocyte; mono., monocyte; MOP, monocyte progenitor; MPP, multipotent progenitor; Neut., neutrophil; NK, natural killer; Promono., promonocyte. c, Top: box and whisker plots showing proportional contribution of signals (lymphomyeloid-primed progenitor, ELP and later B-cell stages combined (i.e., pre-/pro-B, pro-B, pre-B and naive B)) to the transcriptome of leukemias (see x axis labels). Bottom: box and whisker plots summarizing the ratio of ELP to later B-cell stage signals. Center lines represent the median, box limits represent 25%/75% quartiles and whiskers represent minimum/maximum (top) and 1.5× interquartile range (bottom). n is the number of biologically independent variables, as listed below each group of plots. Risk refers to the clinical cytogenetic risk as defined in the protocol of the current European ALL trial ‘ALLTogether’ (EudraCT 2018-001795-38).

