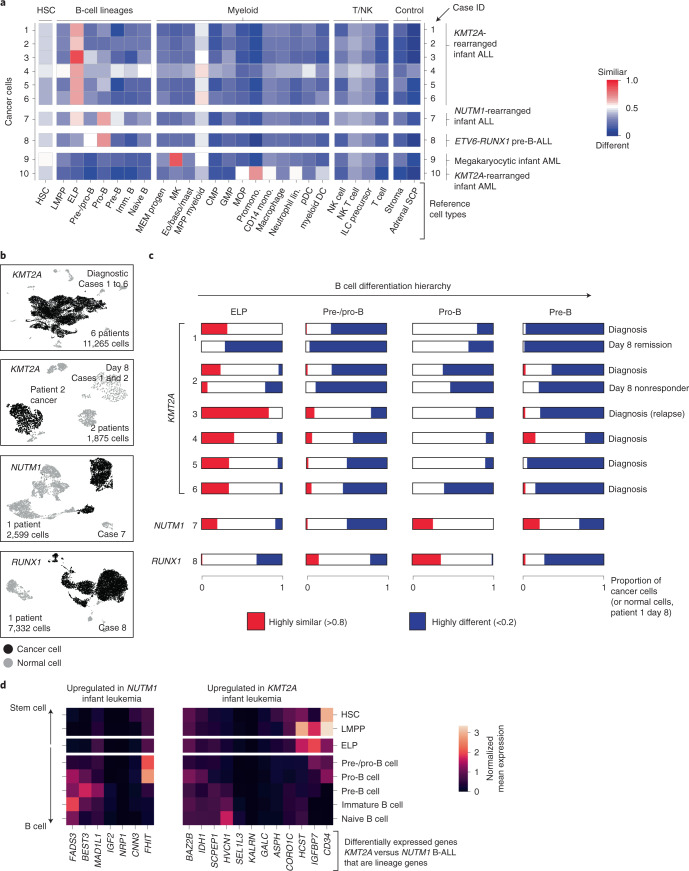
Fig. 2. Validation of ELP signals by direct single cancer cell to normal cell comparison.
a, Heatmap comparing cell clusters from diagnostic specimens (y axis) to normal human fetal bone marrow cell types (x axis; bold labels highlight cell types shown in C). Cell clusters represent cancer (as defined by clinical diagnostic flow cytometric profiles, see Extended Data Fig. 2) and normal cells of individual patient samples (as per case ID number; see Supplementary Table 3 for an overview of patients). All are diagnostic samples at presentation, except case 3 (relapse presentation). Heat colors represent the mean probability (across the cell cluster) of a match as determined by logistic regression (red, similar; blue, different). DC, dendritic cell; GMP, granulocyte–monocyte progenitor; HSC, hematopoietic stem cell; ILC, innate lymphoid cell; Imm., immature; lin., lineage; pDC, plasmacytoid dendritic cell. b, Uniform manifold approximation and projection of B-ALL scRNA-seq data divided by genetic subtype. KMT2A-rearranged B-ALL at diagnosis and day 8 of treatment are presented separately. Within each heatmap, black dots represent cancer and gray dots noncancer. c, Per cancer cell (normal cells for day 8 remission samples of patient 1) logistic regression score against reference B-lineage cell states, with thresholds of >0.8 indicating similarity (red) and <0.2 indicating dissimilarity (blue). d, Subset of differentially expressed genes between infant KMT2A-rearranged B-ALL and NUTM1-rearranged B-ALL. x axis, gene name; y axis, fetal bone marrow cell type. Heatmap shows the average gene expression per reference cell type for genes up-regulated in NUTM1 B-ALL (left) and KMT2A B-ALL (right).

