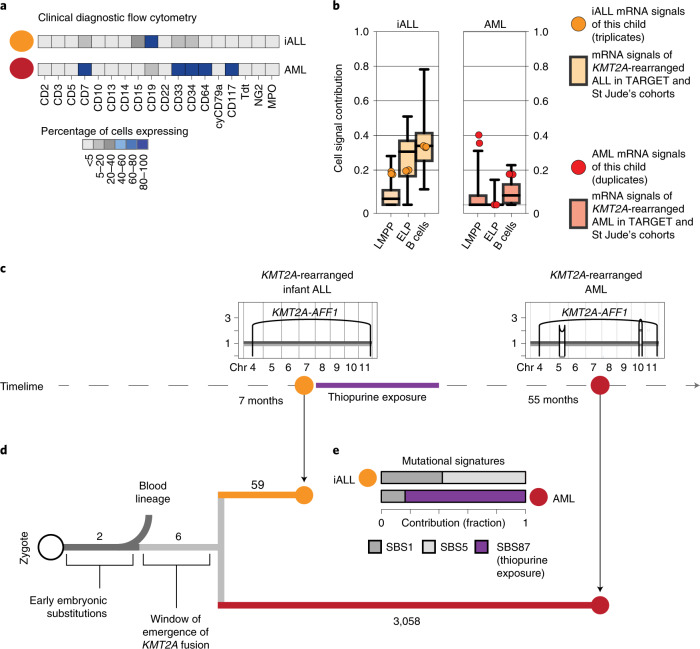
Fig. 3. Phylogenetic timing of the origin of infant ALL.
a, Diagnostic flow cytometry of two leukemias that arose in the same child 4 years apart: KMT2A-rearranged infant ALL (yellow, abbreviated iALL) and KMT2A-rearranged AML (red). MPO, myeloperoxidase. b, Cell signal assessment of bulk transcriptomes generated from this child (ALL in technical triplicates, AML in technical duplicates) shows that the cell signals (LMMP, ELP and B cells (i.e., the sum of all B-cell signals)) of ALL (yellow circle) and AML (red circle) follow the pattern of KMT2A-rearranged ALL (left, boxplots in background, n = 52 biologically independent samples) and KMT2A-rearranged AML (right, boxplots in background, n = 86 biologically independent samples), as defined in the St Jude’s and TARGET cohorts. Boxplot center line represents the median, whiskers represent minimum/maximum and box limits represent 25%/75% quartiles. c, Timeline with copy-number profiles of chromosomes 4 to 11 (all other chromosomes were diploid) in both leukemias showing chromosomes (x axis) and copy number (y axis), alleles (light and dark grey lines) and rearrangement breakpoints (black vertical lines and arcs), including the chromosome 4:11 translocation underpinning the KMT2A-AFF1 fusion. d, Phylogeny of blood and leukemia lineages with substitution burden defining each branch (number). e, Assessment of mutational signatures as defined by the trinucleotide context of substitutions (nomenclature as per Alexandrov et al.22) highlighting in purple the dominant contribution (as percentage of all clonal substitutions) of signature 87 to AML. This signature is thought to be due to thiopurine agents that the child had received for ALL treatment (see timeline).

