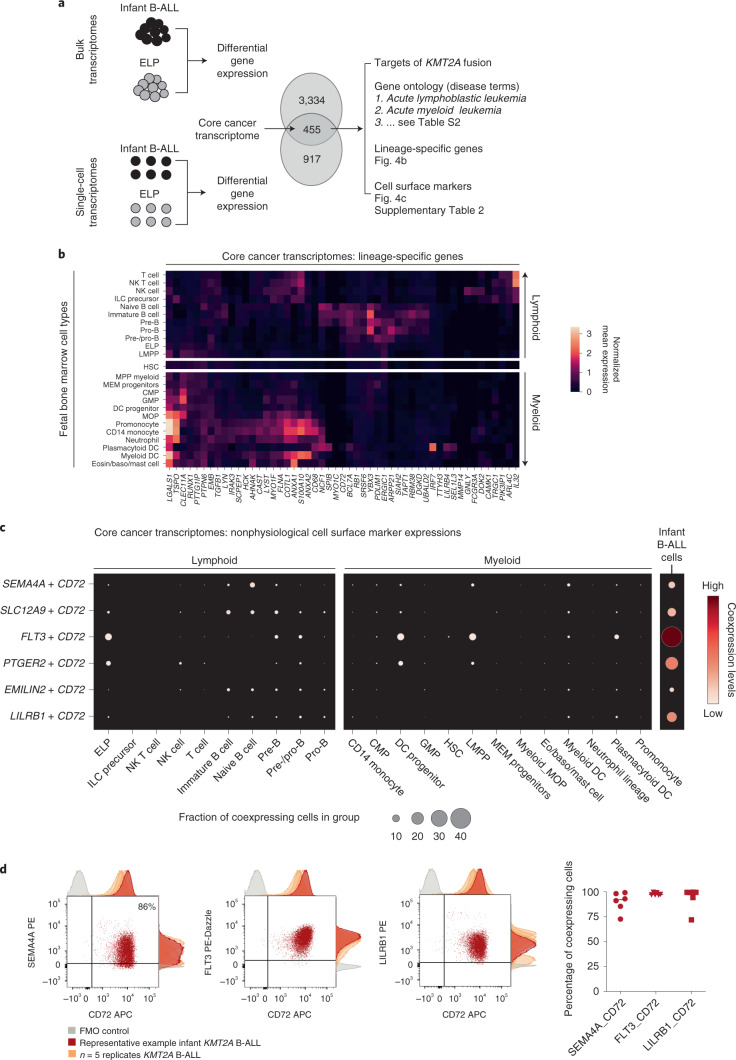
Fig. 4. Therapeutic hypotheses based on the ELP state of infant ALL.
a, Distilling the core cancer transcriptome (i.e., differential gene expression between infant ALL and ELP cells from bulk and single-cell data) to generate a cross-validated gene list that we annotated in three ways (right). b, The core cancer transcriptome encodes a mixed myeloid–lymphoid phenotype. Shown is the log normalized expression (heat color) of genes (x axis) that have relative lineage specificity in normal fetal bone marrow cell types (y axis). Eosin, eosinophil. c, Examples of nonphysiological combinations of cell surface markers that the core cancer transcriptome encompasses. x axis, fetal bone marrow cell type or infant B-ALL lymphoblasts; y axis, marker combinations. Dots represent coexpression of the markers (average of the product of gene expression). Dot size represents the percentage of cells in the cluster that express both markers, and heat color represents the normalized coexpression level. d, Left: dotplots showing coexpression of antigen combinations in a representative primary KMT2A-rearranged infant B-ALL sample, as measured by flow cytometry on live, single CD34+CD19+ blasts. Adjunct histograms show fluorescence-minus-one (FMO) negative controls (gray) and antigen expression in the representative sample (red) compared with n = 2 xenograft samples and n = 3 further primary infant B-ALL samples (orange). APC, allophycocyanin; PE, phycoerythrin. Right: scatterplot demonstrating the percentage of cells in each sample with expression of antigen pair higher than the fluorescence-minus-one control (line represents median).

