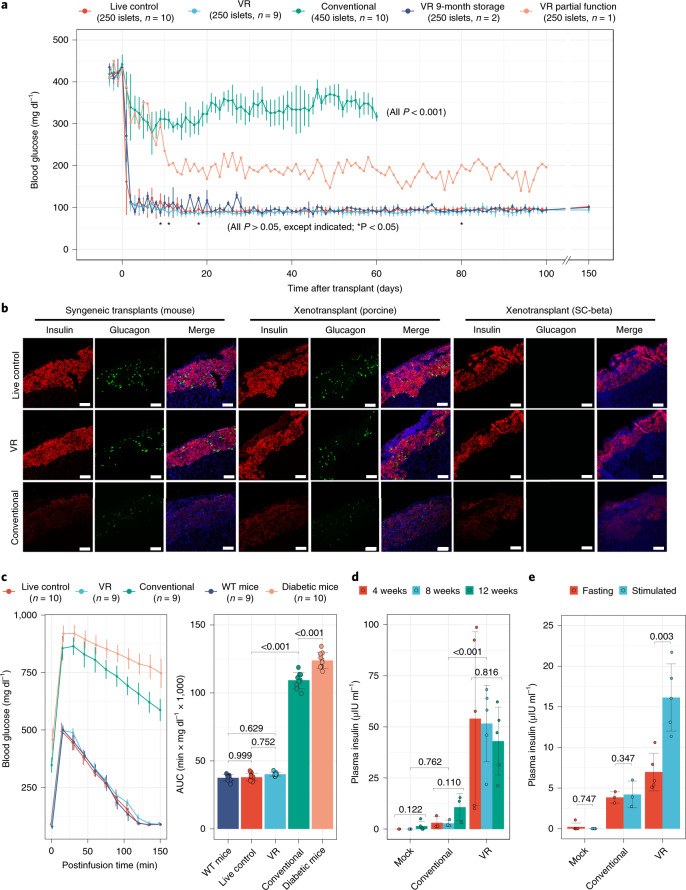
Fig. 6. In vivo function of islets following cryopreservation.
a, Blood glucose levels of streptozotocin-induced diabetic mice after syngeneic transplant of marginal mass mouse islets (250 islets per recipient) from treatment groups, including live control, VR, VR with 9-month cryopreserved storage (islets stored in LN2 for 9 months) and conventional cryopreservation (450 islets per recipient). All pairwise comparisons with P value <0.05 are shown (*P < 0.05), as determined by one-way ANOVA with Games–Howell post hoc test [(n = 10 (control and conventional cryopreservation), 9 (VR), 1 (VR partial function) and 3 (9-month storage and VR)). b, Insulin (red) and glucagon (green) staining in syngeneic (mouse) and xenogeneic (porcine and SC-beta) mouse transplant models. Treatment groups of islets include live control, VR and conventional. 4′,6-Diamidino-2-phenylindole staining (blue) is shown in the merged images. c, IPGTT of wild-type (WT) mice, diabetic mice and diabetic mice transplanted with live control, VR and conventional cryopreserved islets (left). Area under the curve (AUC) of IPGTT (right panel). Groups were compared by one-way ANOVA and Tukey post hoc test, and only informative pairwise comparisons are shown (n = 9–10 per group). d, Xenotransplant of SC-beta islets in NSG mice with nonfasting plasma human insulin levels at 4, 8 and 12 weeks after transplant. e, At 14 weeks, plasma insulin level of NSG mice after fasting and 30 min following stimulated insulin production by intraperitoneal glucose injection. For d and e, group comparison is by one-way ANOVA and Tukey post hoc test with informative comparisons shown (n = 3–5/treatment group). Scale bars, 200 µm. Data are shown as individual data points and mean ± s.d. For c–e, the exact number of replicates can be found in Supplementary Table 3.

