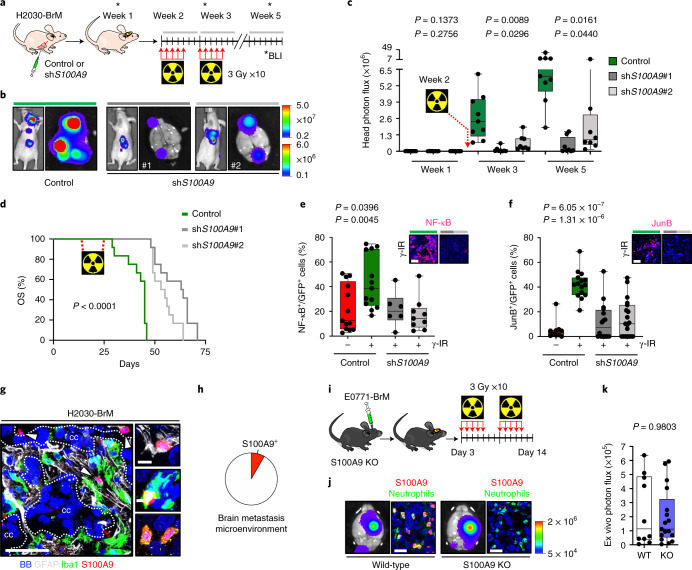
Fig. 3. Targeting S100A9 in cancer cells radiosensitizes experimental lung and breast cancer brain metastases in a NF-κB–JunB-dependent manner.
a, Schema of experimental design. b, Representative BLI of mice 5 weeks after being inoculated IC with H2030-BrM control (left), shS100A9#1 (middle) or shS100A9#2 (right) cells and treated with 10 × 3 Gy irradiation using the WBRT protocol depicted in a. Ex vivo brain BLI is also shown for each condition. Color bars show BLI intensity in p s−1 cm−2 sr−1. BLI colour bars correspond to in vivo (top) and ex vivo (bottom). c, Quantification of in vivo photon flux values from the head of mice inoculated with H2030-BrM control, shS100A9#1 or shS100A9#2 cells that received WBRT, as depicted in a. BLI was performed at three different time points during the course of treatment (weeks 1, 3 and 5). Values are shown in box-and-whisker plots, where every dot represents a different brain and the line in the box corresponds to the median. The boxes go from the upper to the lower quartiles, and the whiskers go from the minimum to the maximum value (n = 9, H2030-BrM control; n = 8, H2030-BrM shS100A9#1; n = 8, H2030-BrM shS100A9#2). P value was calculated using two-tailed t-test. d, Kaplan–Meier plot showing survival proportions of mice inoculated with H2030-BrM control, shS100A9#1 or shS100A9#2 cells that received WBRT as depicted in a (n = 12, each experimental condition). P value was calculated using a log-rank (Mantel–Cox) test. OS, overall survival. e, Quantification of the percentage of NF-κB+ GFP+ positive H2030-BrM control, shS100A9#1 or shS100A9#2 cells in organotypic cultures, which received no or 10 Gy irradiation. Values are shown in box-and-whisker plots, where every dot represents an independent culture and the line in the box corresponds to the median. The boxes go from the upper to the lower quartiles and the whiskers go from the minimum to the maximum value (n = 13, H2030-BrM control; n = 13, H2030-BrM control + γ-IR; n = 6, shS100A9#1 + γ-IR; n = 9, shS100A9#2 + γ-IR). P values were calculated using two-tailed t-tests. Upper panel shows representative organotypic cultures from the experiment in the panel. Scale bar, 75 µm. f, Quantification of the percentage of JunB+ GFP+ BrM cells in nonirradiated H2030-BrM control and irradiated H2030-BrM control, H2030-BrM shS100A9#1 or H2030-BrM shS100A9#2 brain metastatic lesions. Values are shown in box-and-whisker plots, where every dot represents a metastatic lesion and the line in the box corresponds to the median. The boxes go from the upper to the lower quartiles, and the whiskers go from the minimum to the maximum value (n = 10 metastases from 2 animals, H2030-BrM control; n = 15 metastases from 2 animals, H2030-BrM control + γ-IR; n = 16 metastases from 3 animals, H2030-BrM shS100A9#1 + γ-IR; n = 19 metastases from 3 animals, H2030-BrM shS100A9#2 + γ-IR). P values were calculated using two-tailed Mann–Whitney tests. Upper panel shows representative organotypic cultures from the experiment in the panel. Scale bar, 75 µm. g, Representative images of an established H2030-BrM brain metastasis and its microenvironment. The S100A9 antibody used for this staining is rodent specific to stain only the microenvironment and not human cancer cells. Arrowheads point to S100A9+ cells in the microenvironment. CC, cancer cells. The image is representative of the five independent brains evaluated. Scale bars, 50 µm (left panel) and 10 µm (right panels). h, Quantification of S100A9+ BB+ cells in the microenvironment of brain metastasis. Only GFP− cells were quantified to exclude cancer cells. Pie chart represents S100A9+ GFP− BB+ cells as the red slice (8.29%) and S100A9− GFP− BB+ cells as the white slice. Cells were quantified in nine fields of view (FOVs) representing equally different sizes of metastasis from three mice brains. i, Schema of experimental design. j, Representative bioluminescence and immunofluorescent images of ex vivo brains from S100A9+/+ or S100A9−/− mice 2 weeks after intracranial injection of E0771-BrM cells. After inoculation, mice were consequently treated with WBRT as shown in i. Neutrophils are labeled with NIMP-R14 antibody (green). The bioluminescence images are representative of the 15 brains analyzed, and the immunofluorescence images are representative of the six brains analyzed. Color bar shows BLI intensity in p s−1 cm−2 sr−1). Scale bar, 25 µm. k, Quantification of ex vivo brain photon flux values from S100A9+/+ or S100A9−/− mice inoculated with E0771-BrM cells and treated with WBRT as depicted in i. Values are shown in box-and-whisker plots, where every dot represents a different brain and the line in the box corresponds to the median. The boxes go from the upper to the lower quartiles, and the whiskers go from the minimum to the maximum value (n = 10, S100A9+/+ mice; n = 16, S100A9−/− mice). P value was calculated using Mann–Whitney test, two sided. KO, knockout; WT, wild-type.

