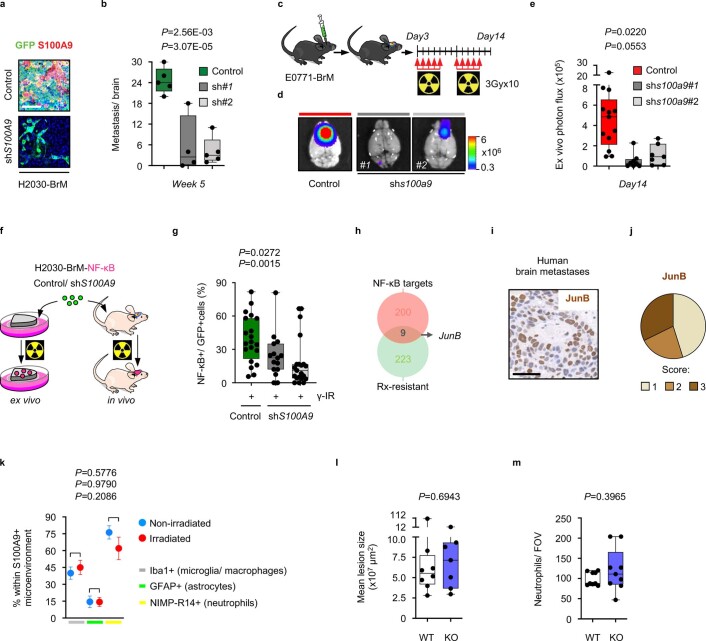
Extended Data Fig. 3. Targeting S100A9 in cancer cells radiosensitizes experimental lung and breast cancer brain metastases in a NF-κB–JunB-dependent manner.
a, Representative images of histology of brain metastatic lesions from experiment in Fig. 3a-c. GFP: cancer cells. Scale bar: 100 µm. b, Quantification of the number of brain metastatic lesions in mice inoculated with H2030-BrM control, shS100A9#1 or shS100A9#2 cells and treated with WBRT. Metastatic burden was assessed at endpoint by histology. Values are shown in box-and-whisker plots where every dot represents a different brain and the line in the box corresponds to the median. The boxes go from the upper to the lower quartiles and the whiskers go from the minimum to the maximum value (n = 5, H2030-BrM Control; n = 4, H2030-BrM shS100A9#1; n = 5, H2030-BrM shS100A9#2). P value is calculated using two-tailed t test. c, Schema of experimental design. d, Representative bioluminescence images of ex vivo brains from mice two weeks after intracranial injection of E0771-BrM cells transduced with either a scrambled shRNA as Control, or one of two different shRNA against murine S100a9 sh#1 or sh#2. After inoculation, mice were consequently treated with WBRT as shown in (c). e, Quantification of ex vivo brain photon flux values from irradiated mice inoculated with E0771-BrM Control, shS100a9#1 or shS100a9#2. Values are shown in box-and-whisker plots where every dot represents a different brain and the line in the box corresponds to the median. The boxes go from the upper to the lower quartiles and the whiskers go from the minimum to the maximum value (n = 13, E0771-BrM Control; n = 8, E0771-BrM shs100a9#1; n = 7, E0771-BrM shs100a9#2). P value is calculated using two-tailed t test. f, Schema of experimental design. H2030-BrM control or shS100A9 cells engineered with a NF-κB-mCherry reporter were used ex vivo in organotypic cultures or IC injected in mice. g, Quantification of the percentage of NF-κB + GFP + positive cells in irradiated brain metastatic lesions in vivo, generated from IC injection of H2030-BrM control, H2030-BrM shS100A9#1 or H2030-BrM shS100A9#2 cells (n = 4 mice, each experimental condition). Values are shown in box-and-whisker plots where every dot represents a metastatic lesion and the line in the box corresponds to the median. The boxes go from the upper to the lower quartiles and the whiskers go from the minimum to the maximum value (n = 20 FOV, H2030-BrM Control + γ-IR; n = 13 FOV, H2030-BrM shS100A9#1 + γ-IR; n = 21 FOV, H2030-BrM shS100A9#2 + γ-IR). P value was calculated using two-tailed Mann–Whitney Test. h, Venn diagram showing the overlap of 9 genes (including JunB) between established NF-κB targets and genes significantly upregulated in both in vitro and ex vivo radioresistant culture preparations (Supplementary Table 12). i, Representative image of JunB staining by immunohistochemistry in human brain metastases. Scale bar: 50 µm. This analysis was repeated 62 independent samples. j, 62 human brain metastases from lung cancer patients (33 cases), breast cancer patients (27 cases) or patients with other primary tumors (2 cases) were stained for JunB. Quantification of histological scoring of cancer cells is shown in a pie chart. 28/62 were scored with weak staining (score 1), 14/62 with moderate staining (score 2) and 20/62 with strong staining (score 3). k, Quantification of S100A9 + GFAP + , S100A9 + Iba1+ and S100A9 + NIMP-R14 + cells in the microenvironment of H2030-BrM brain metastasis by double-immunofluorescent staining of unirradiated and irradiated mice brains. Values shown are percentages of all microenvironmental S100A9 + cells. Dots correspond to the mean and error bars correspond to sem. 6-10 FOV per condition from 3 (nonirradiated) and 2 (irradiated) brains were quantified. P values were calculated using two-tailed t test. l, Quantification of brain metastatic lesion size by histology of brains obtained from experiment depicted in Fig. 3i. Values are shown in box-and-whisker plots where every dot represents a different brain and the line in the box corresponds to the median. Whiskers go from the minimum to the maximum value (n = 8, S100A9+/+ mice; n = 7, S100A9-/- mice). P value was calculated using Mann–Whitney test, two sided. m, Quantification of neutrophils by histology of brains obtained from experiment depicted in Fig. 3i. Values are shown in box-and-whisker plots where every dot represents a different field of view and the line in the box corresponds to the median. Whiskers go from the minimum to the maximum value (n = 9 fields of view obtained from 3 S100A9+/+ and 3 S100A9+/+ mice). P value was calculated using Mann–Whitney test, two sided.

