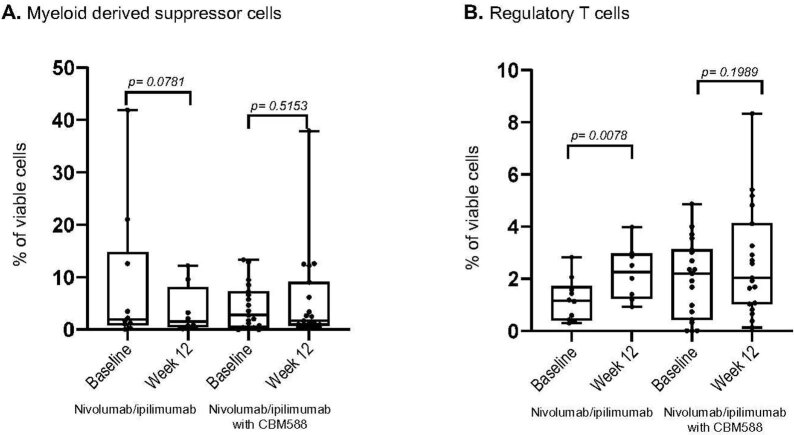
Extended Data Fig. 6. Changes in myeloid-derived suppressor cell and regulatory T cell populations by time in nivolumab/ipilimumab arm (a) and nivolumab/ipilimumab with CBM588 arm (b).
Changes in myeloid-derived suppressor cell and regulatory T cell populations by time in nivolumab/ipilimumab arm (a) and nivolumab/ipilimumab with CBM588 arm (b). Immune cell populations were assessed in n=54 blood samples from n=27 patients (n=19 patients in nivolumab/ipilimumab with CBM588 arm and n=8 patients in nivolumab/ipilimumab arm). Wilcoxon test was used to compare immune cell populations at two timepoints. The length of the box plots represents the interquartile range (IQR) and the inside lines of the boxes represent the median. Whiskers (the vertical lines extending below and above each box) are used to represent the minimum and the maximum observation.

