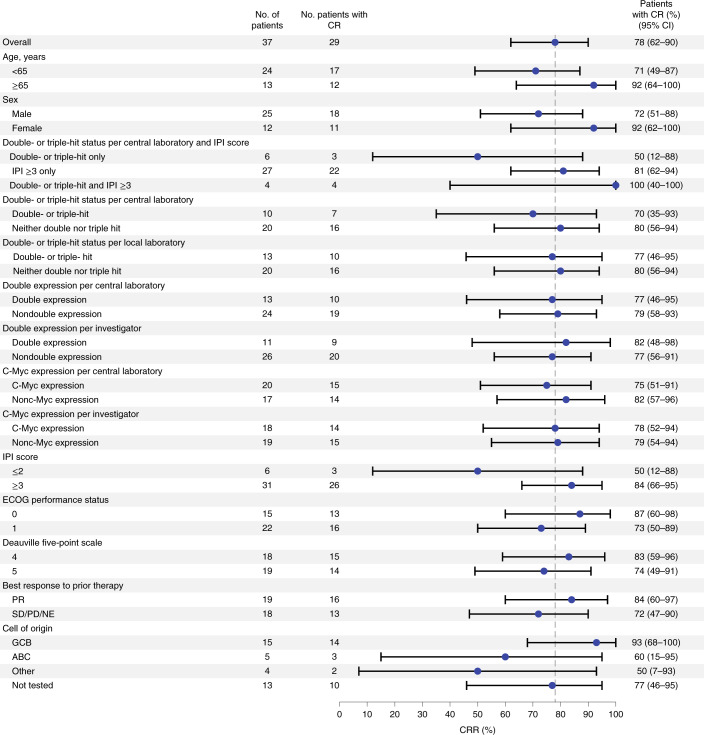
Fig. 2. Forest plot representing subgroup analyses of CRR in patients included in primary efficacy analysis.
Response assessments, according to Lugano classification30, are displayed regarding CRR for subgroups of interest within the efficacy-evaluable population (n = 37). Data for each group are presented as the proportion of patients with CR and 95% CI (based on the Clopper–Pearson method). Dashed vertical line represents the point estimate of the overall population.

