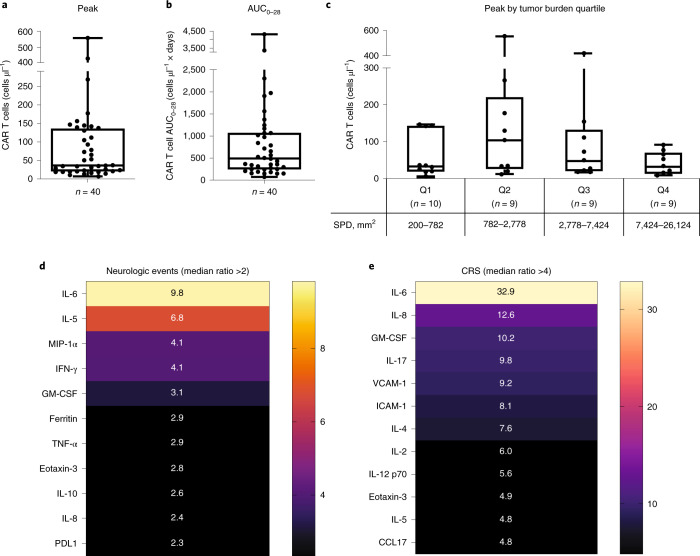
Fig. 3. Levels of CAR T cells in blood and association of serum cytokines with adverse events.
a,b, Peak levels of CAR T cells reached in the blood (a) and AUC0–28 (b). c, Peak CAR T-cell levels by tumor burden quartile, as determined by SPD of target lesions. For all box plots, the center line denotes the median, box limits the upper and lower quartiles and whiskers 1.5× interquartile range. d,e, Selected cytokines associated with neurologic events (d) and CRS (e) with median ratio >2 based on ratio of median peak levels in grade ≥3 events to grade 2, grade 1 or no events. Resultant values with ratio >2 for neurologic events and >4 for CRS are depicted. Color scales indicate the median ratio, with increasing intensity representing higher values. CCL, chemokine ligand; ICAM-1, intercellular adhesion molecule-1; MIP-1, macrophage inflammatory protein-1; VCAM-1, vascular cell adhesion protein-1.

