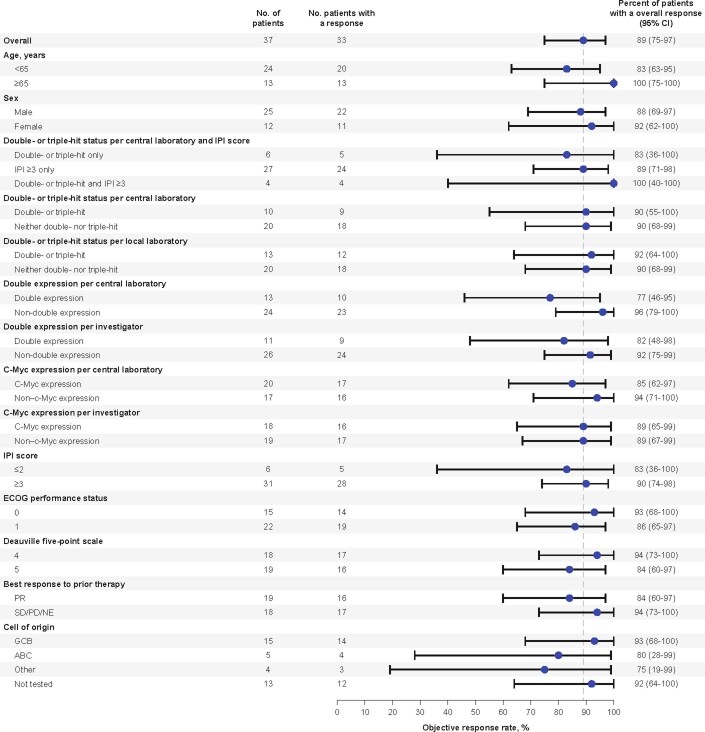
Extended Data Fig. 2. Subgroup analyses of objective response rates (N = 37).
Response assessments were per Lugano Classification26. Data for each group are presented as the proportion of patients with an objective response, with a 95% CI (Clopper-Pearson method). The dotted vertical line presents the point estimate of overall population. ABC, activated B-cell; CI, confidence interval; ECOG, Eastern Cooperative Oncology Group; GCB, germinal center B-cell; IPI, International Prognostic Index; NE not evaluable; PD, progressive disease; PR, partial response; SD, stable disease.

