
Figure 2.
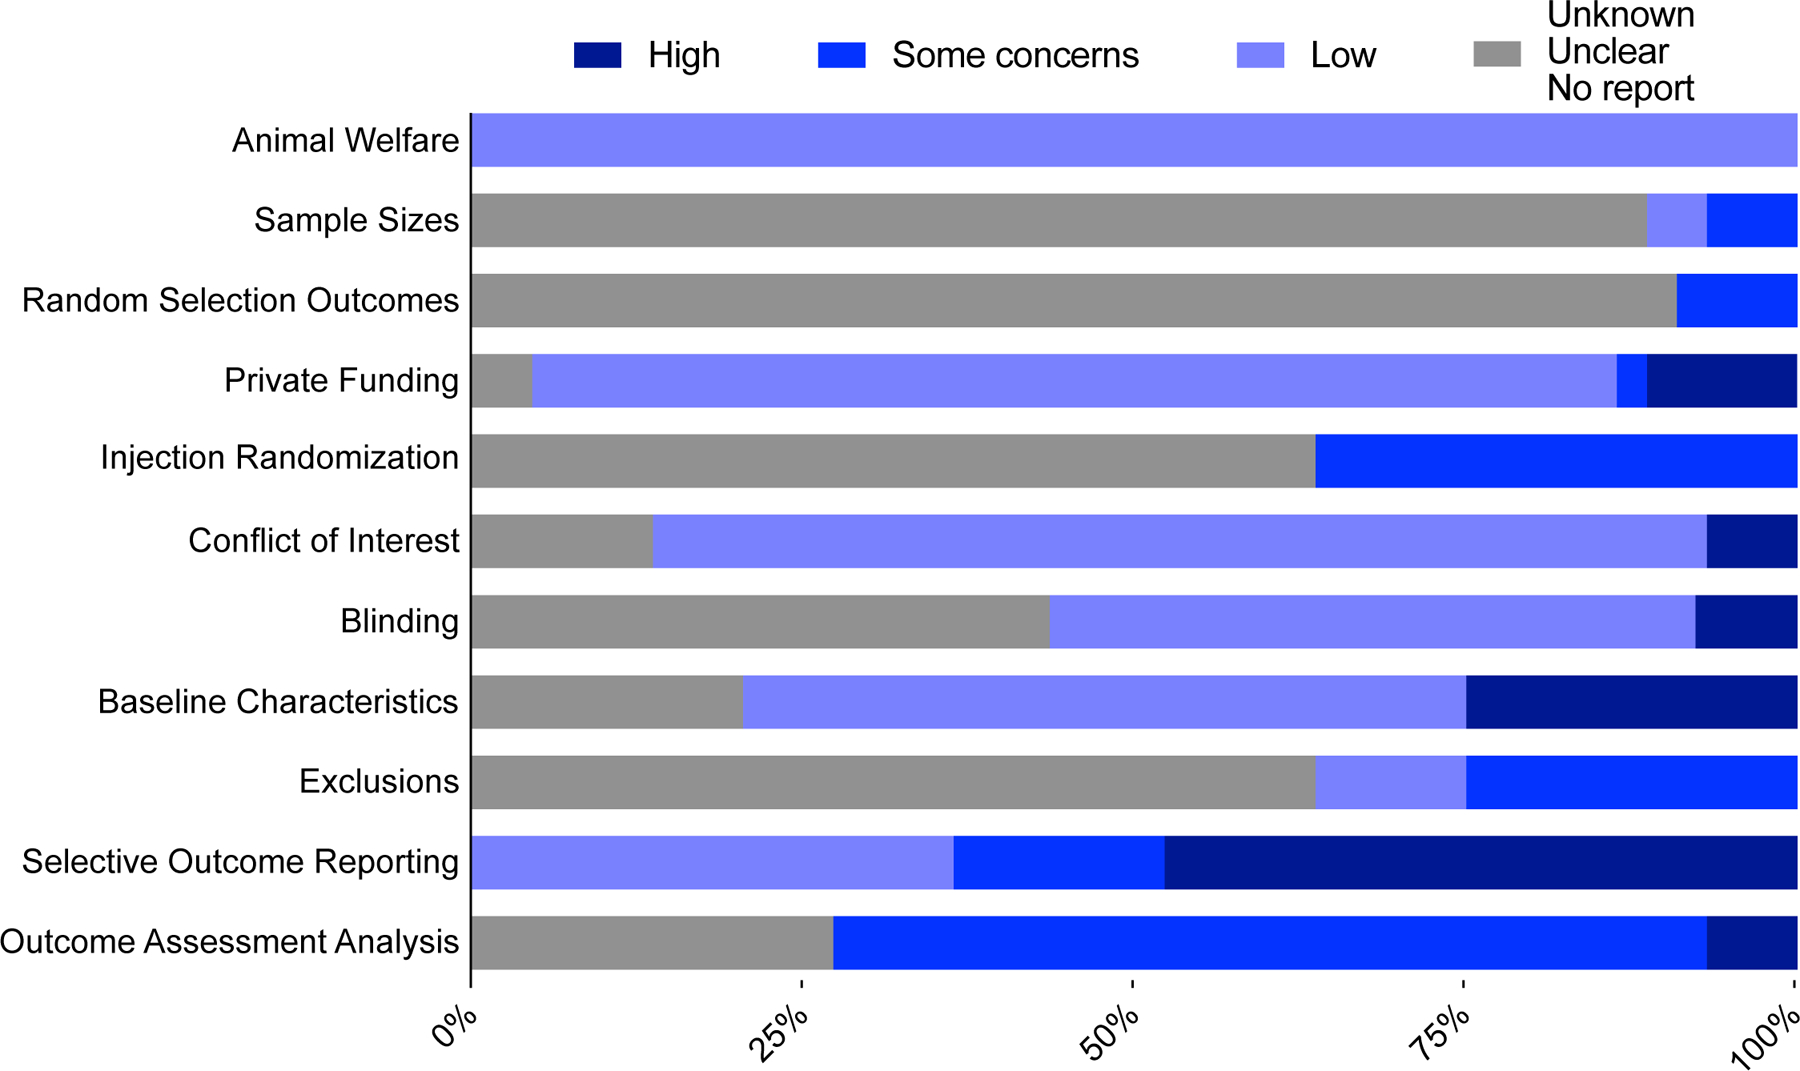
Stacked bar chart of quality assessments on risks of bias. Darkest blue indicates high risk of bias, medium blue indicates some concerns, light blue indicates low risk of bias, and gray bars indicate percentage of studies for which no determination could be made. Rubric, adapted from the Systematic Review Centre for Laboratory Animal Experimentation’s Risk of Bias tool, is detailed in the supplemental file.