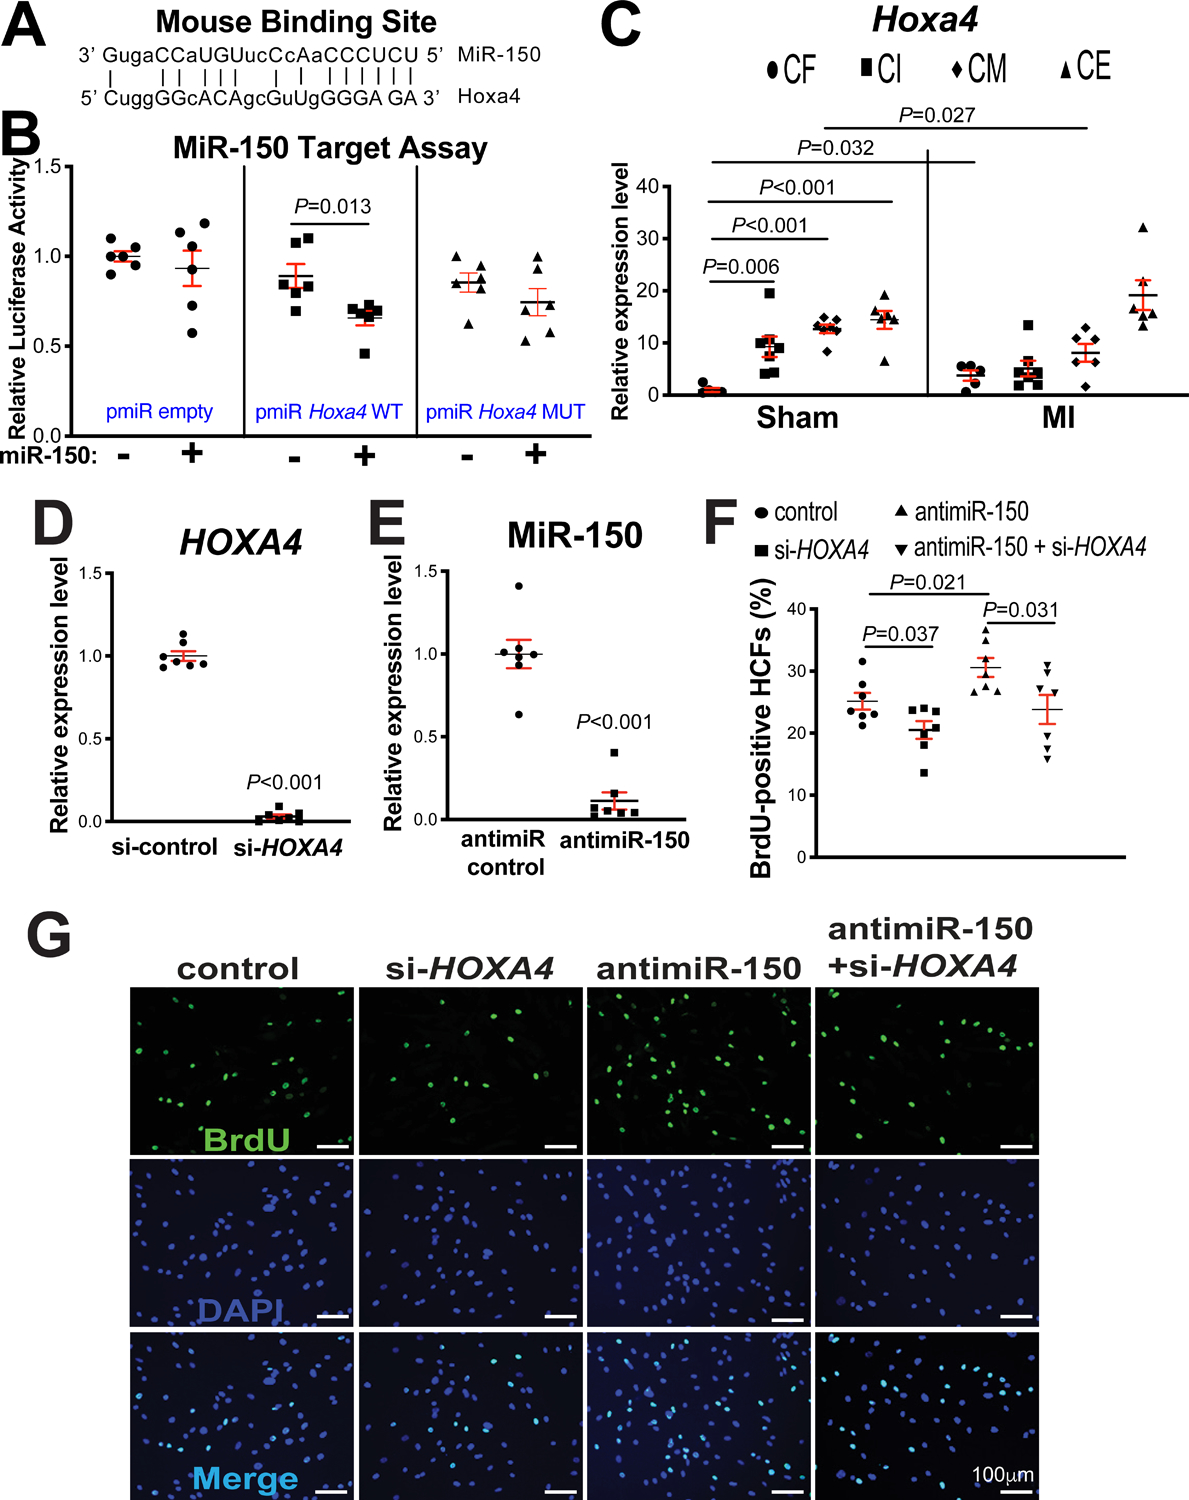
Figure 5. Homeobox a4 (Hoxa4) is a novel direct target of miR-150, and HOXA4 is necessary for miR-150-dependent regulation of human cardiac fibroblast (HCF) proliferation.

A, Mouse Hoxa4 has a miR-150 binding site in the 3’-untranslated region (3’UTR). MiR-150 seed pairing in the target region is shown as vertical lines. B, MiR-150’s ability to directly repress the activity of luciferase (LUC) reporter constructs that contain either wild type (WT) or mutated (MUT) binding site for Hoxa4. Transfection with or without miR-150 mimic in H9c2 cells is indicated. Firefly LUC activity was normalized to Renilla LUC activity and compared with empty vector measurements. N=6. Unpaired 2-tailed t-test. C, Real-Time Quantitative Reverse Transcription (QRT)-PCR expression analysis of Hoxa4 in cardiac fibroblasts (CFs), cardiac inflammatory cells (CIs), cardiomyocytes (CMs), and cardiac endothelial cells (CEs) isolated from adult mouse hearts at 7 days post-myocardial infarction (MI). N=5–7. Hoxa4 expression compared to glyceraldehyde-3-phosphate dehydrogenase (Gapdh) was calculated using 2−ΔΔCt, and data are shown as fold induction of Hoxa4 expression levels normalized to CF sham. Two-way ANOVA with Tukey multiple comparison test. D–E, HCFs were transfected with control scramble siRNA (si-control) or HOXA4 siRNA (si-HOXA4) (D) and with antimiR control or antimiR-150 (E). QRT-PCR analyses for HOXA4 (D) or miR-150 (E) were performed to check the knockdown efficiency. Data were normalized to GAPDH (D) or U6 SNRNA (E) and expressed relative to controls. N=7 per group. Unpaired 2-tailed t-test. F-G, RNA interference with HOXA4 protects HCFs from the increased proliferation mediated by antimiR-150. HCFs were transfected as indicated, and bromodeoxyuridine (BrdU) assays were then performed. The percentage of proliferating nuclei (green) was calculated by normalizing total nuclei (blue). N=7 per group. One-way ANOVA with Tukey multiple comparison test.
