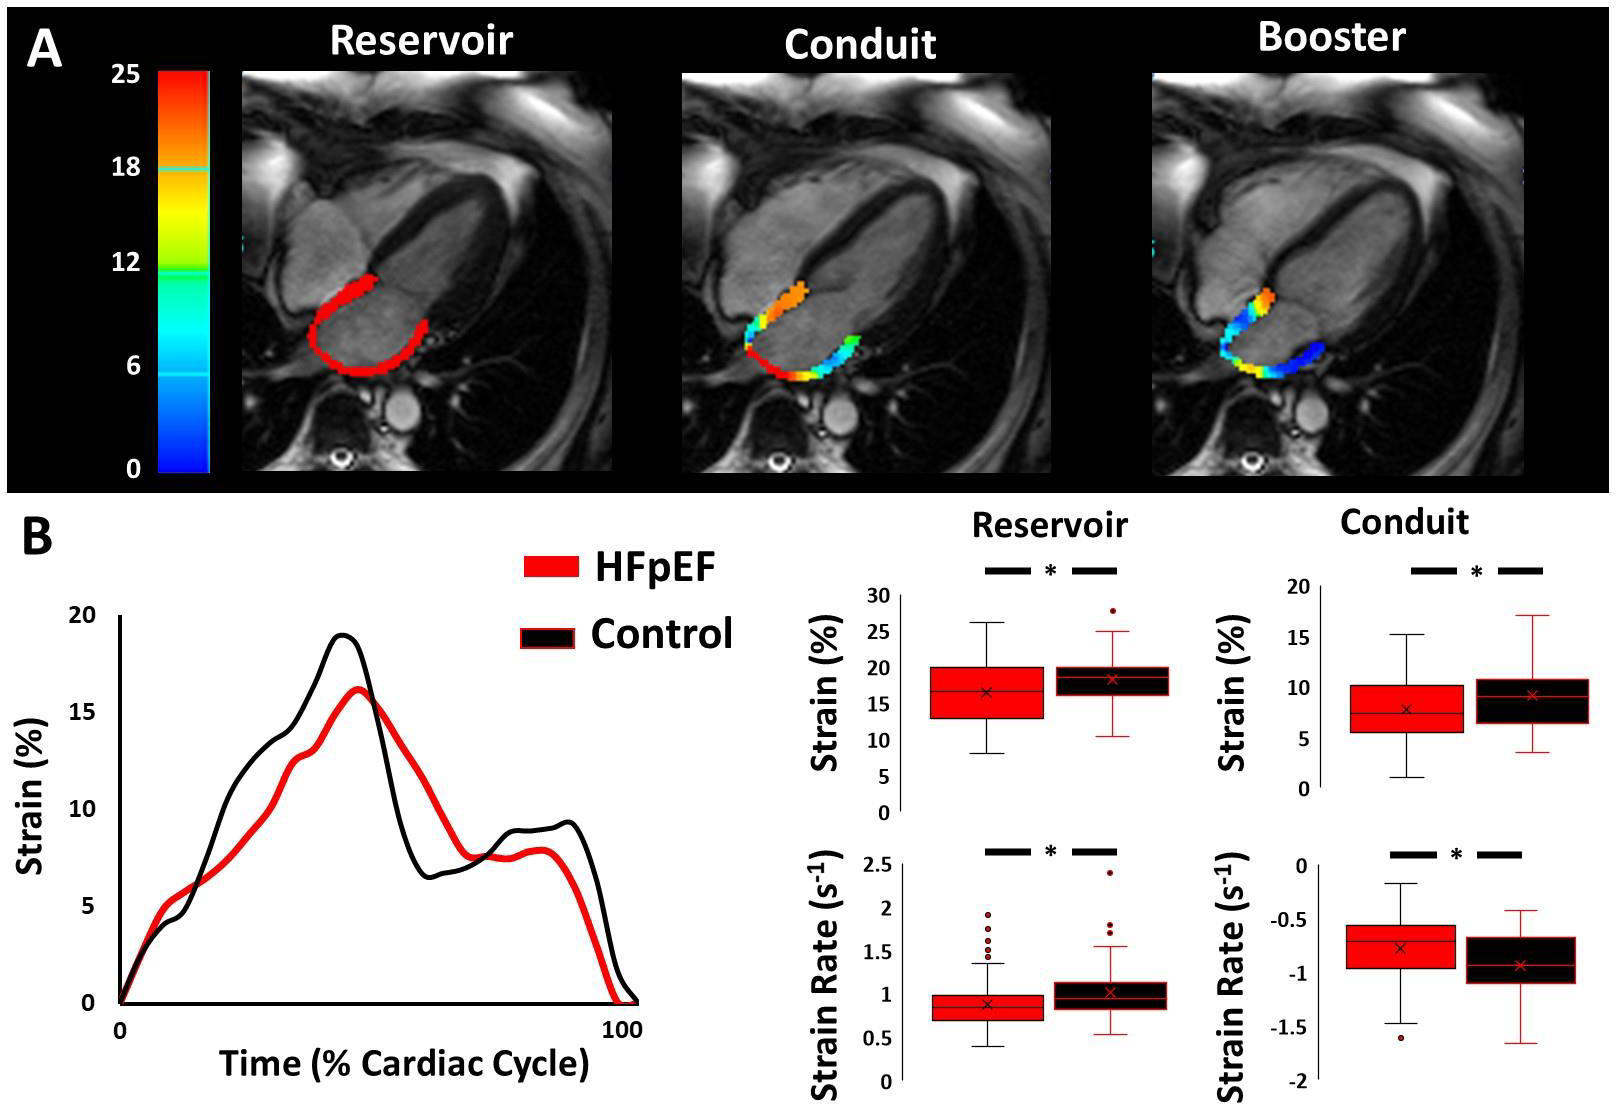
FIGURE 1.

Impaired left atrial function in HFpEF compared to controls. (A) High resolution long-axis magnetic resonance cine images illustrating left atrial strain color maps across each phase of the cardiac cycle. (B) Strain curves from a representative control participant (black line) and HFpEF participant (red line). Note that peak reservoir strain is reduced in the HFpEF participant compared to the control participant, together with reduced reservoir and conduit strain rates. (C) Summary data (unadjusted) showing key group differences in left atrial mechanics between HFpEF (red bars) and controls (black bars).
