
Figure 4. Effect of NAT1 deletion on individual cell motility in MDA-MB-231 breast cancer cells.
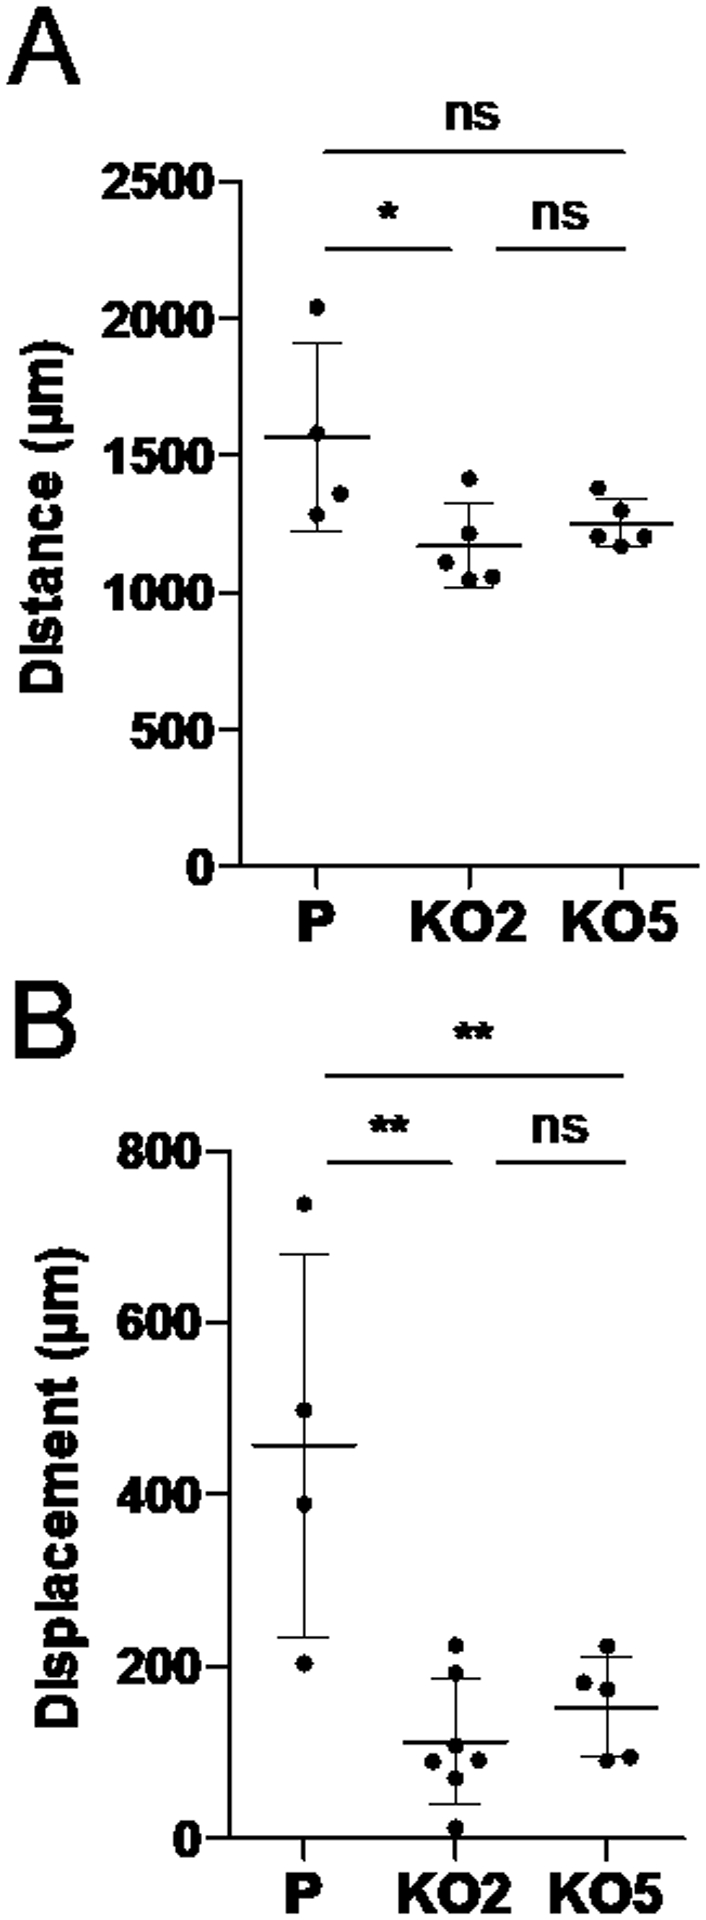
Live-cell imaging of the parental and NAT1 KO MDA-MB-231 cells. The parental and NAT1 KO (KO2 and KO5) cells were plated on standard culture plates and allowed to attach for 24 h. The cells were continuously monitored every 15 min for 24 h to track movement of individual cells in the field. Based on the images acquired, the total distance traveled (in μm) and displacement (in μm) were measured for individual cells. The graphs represent the mean ± SEM (n=4–7 per group). *, p<0.05; **, p<0.01. P, parental; KO2, NAT1 KO cell line #2. KO5, NAT1 KO cell line #5.