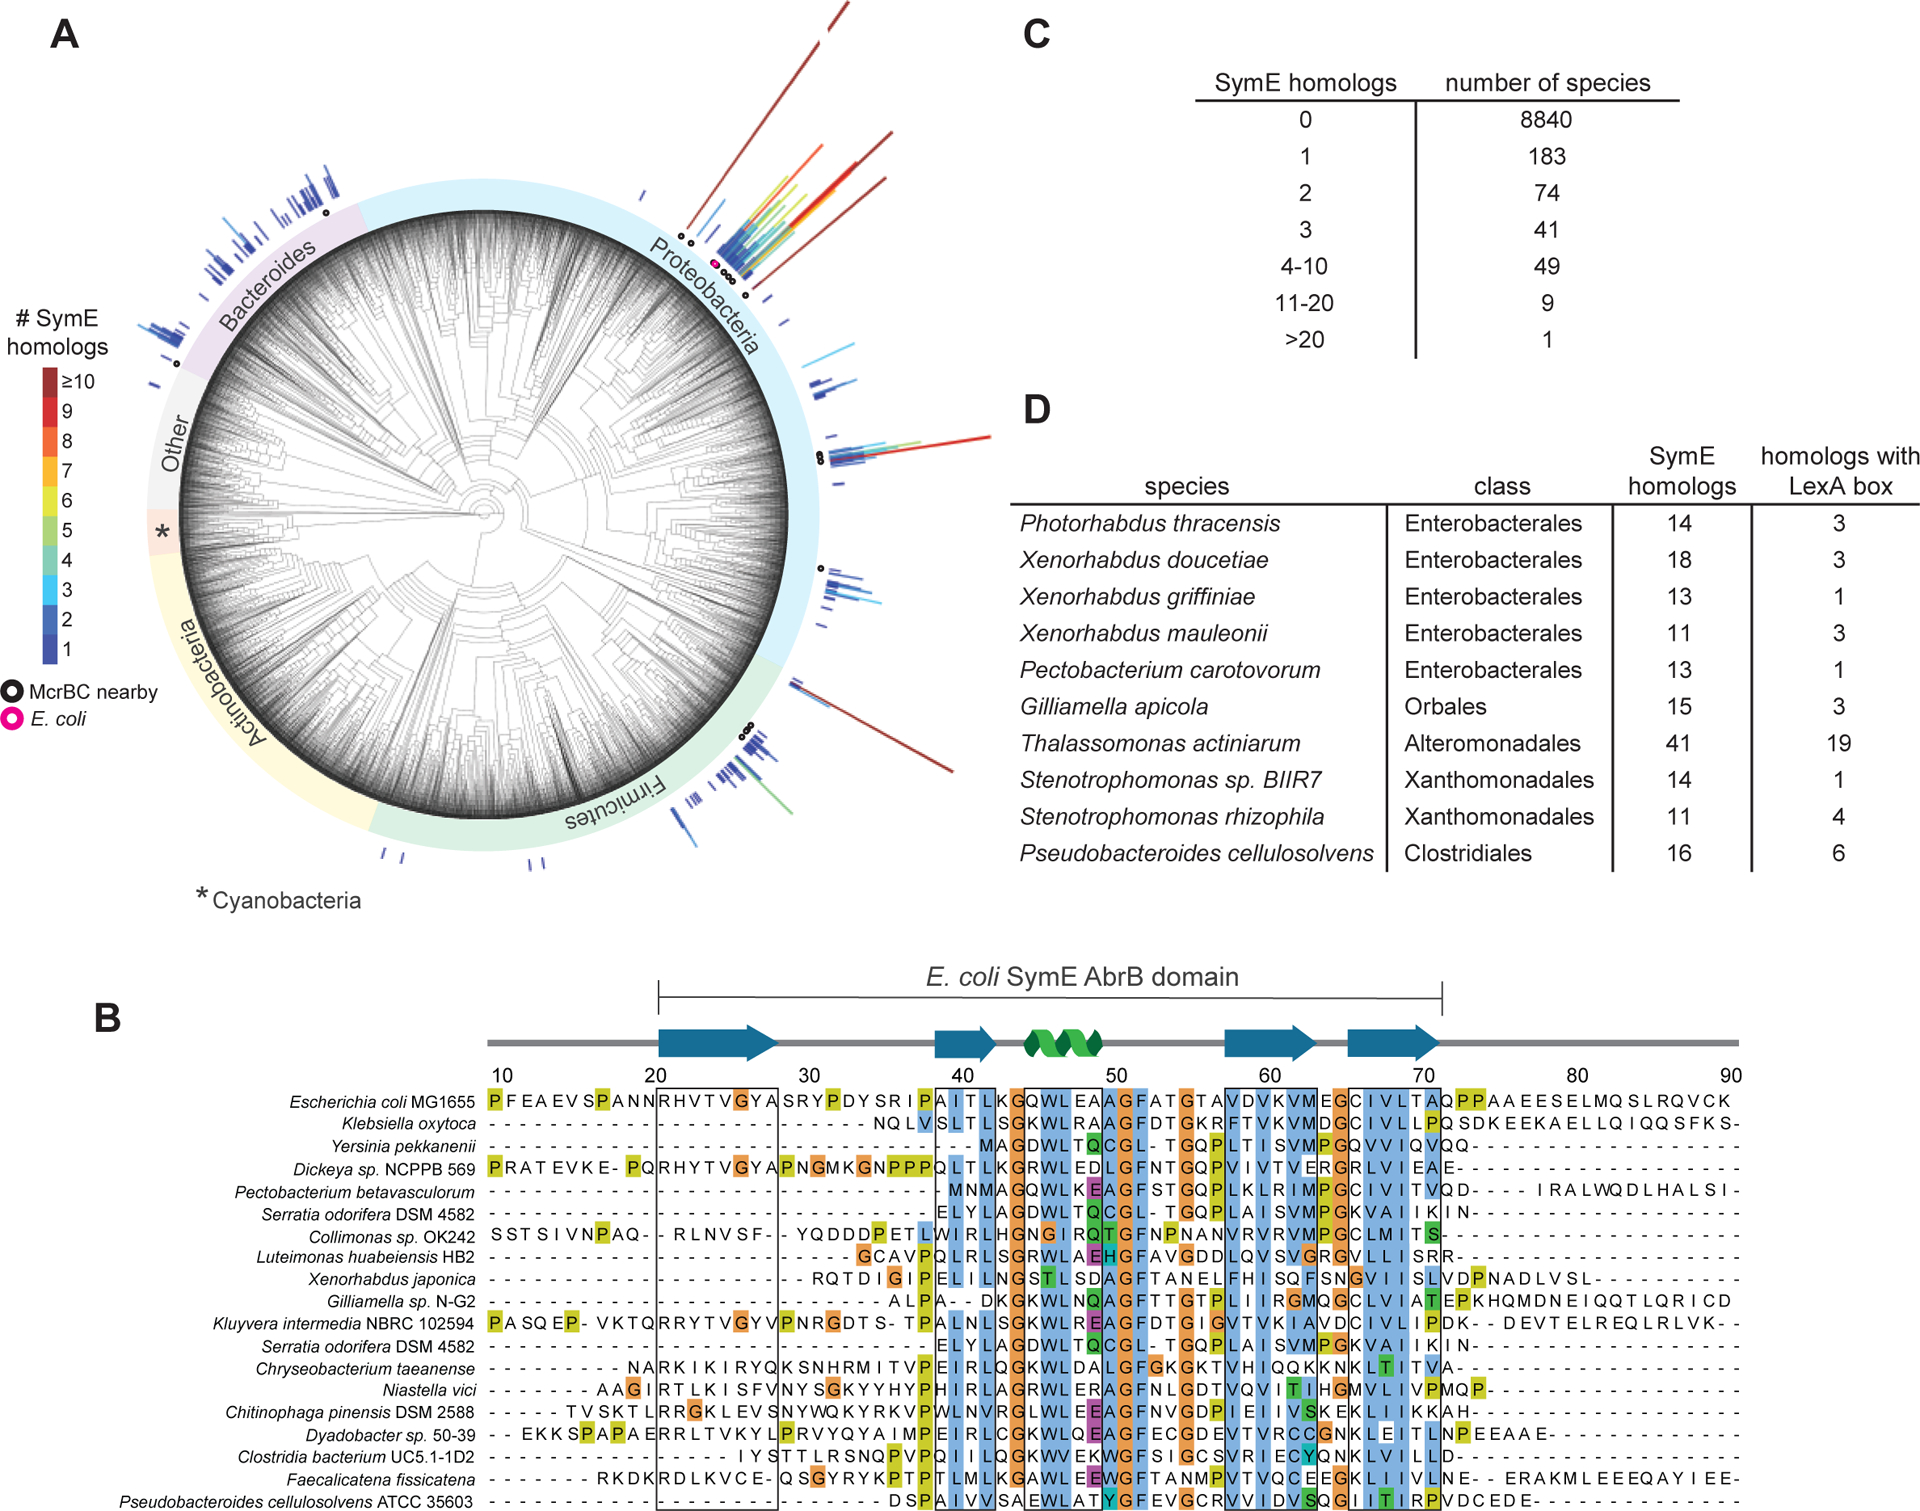
Figure 2. Bioinformatic analysis of SymE.

(A) Phylogenetic tree showing the distribution of symE throughout bacteria. Each radial line appears above a species that encodes a SymE homolog, with the length and color of the line denoting how many copies of symE occur in that species. Homologs encoded near an mcrBC locus are shown with a black circle under the line, and E. coli is denoted with a pink circle. The ‘Other’ group contains uncharacterized outgrouping bacteria.
(B) Sequence alignment of representative SymE homologs from Proteobacteria, Firmicutes, and Bacteroides. SymE is most conserved in the area of the protein that is predicted to have an AbrB-like fold. Sequences that correspond to β-sheets or α-helices are boxed in grey.
(C) Tabulated summary of how many species harbor the indicated number of paralogs.
(D) Summary of the species identified with more than 10 paralogs of SymE.
