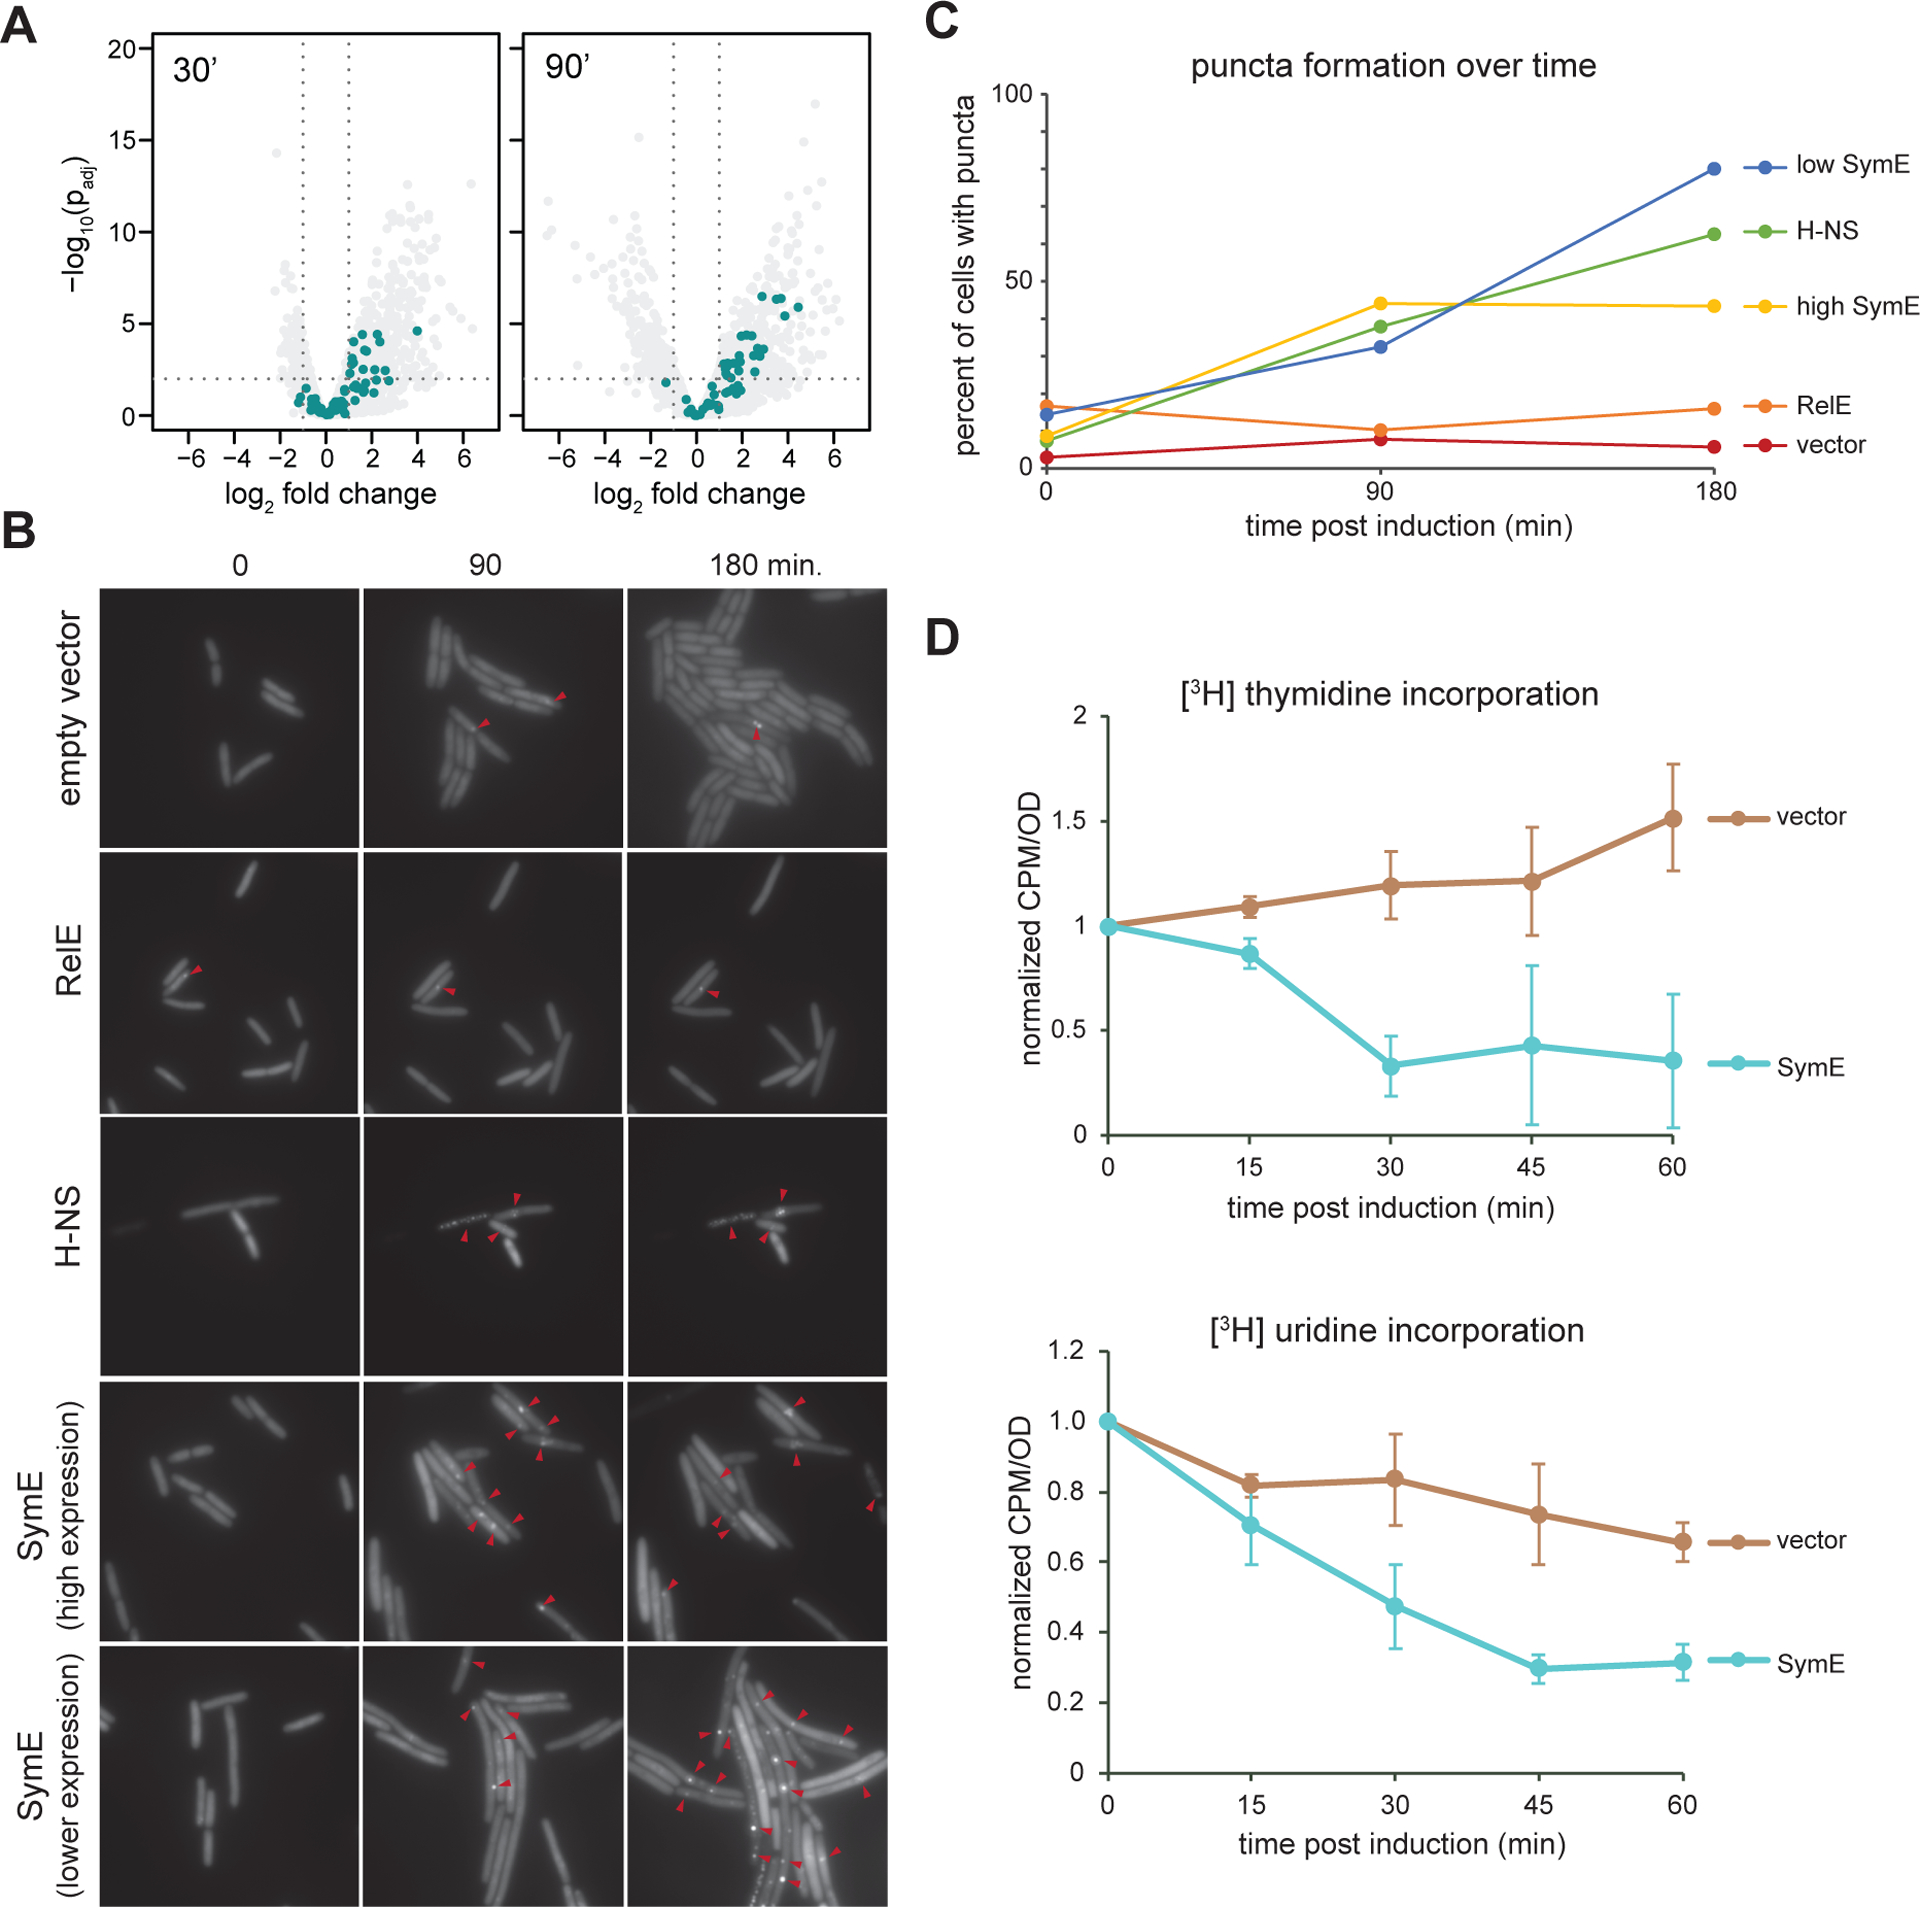
Figure 7. Overproducing SymE causes double-strand breaks, and inhibits DNA and RNA synthesis.

(A) Same volcano plots as in Figure 3E, but with SOS-induced genes shown in teal.
(B) Time-lapse microscopy of cells producing Gam-GFP, which forms foci at double-strand breaks, and expressing high levels of symE, lower levels of symE, relE, or hns.
(C) Graph of percentage of cells with at least one Gam-GFP focus for each condition over time. n ≥ 85 cells for each data point.
(D) [3H]-thymidine (top) and [3H]-uridine (bottom) incorporation assays, comparing the counts per minute (corresponding to incorporated [3H]) per OD600 of cells at various time points post induction of E. coli cells harboring an empty vector versus a symE expression vector (the “high symE” vector from (B) and (C)). n ≥ 3 for all conditions; error bars indicate standard deviation.
