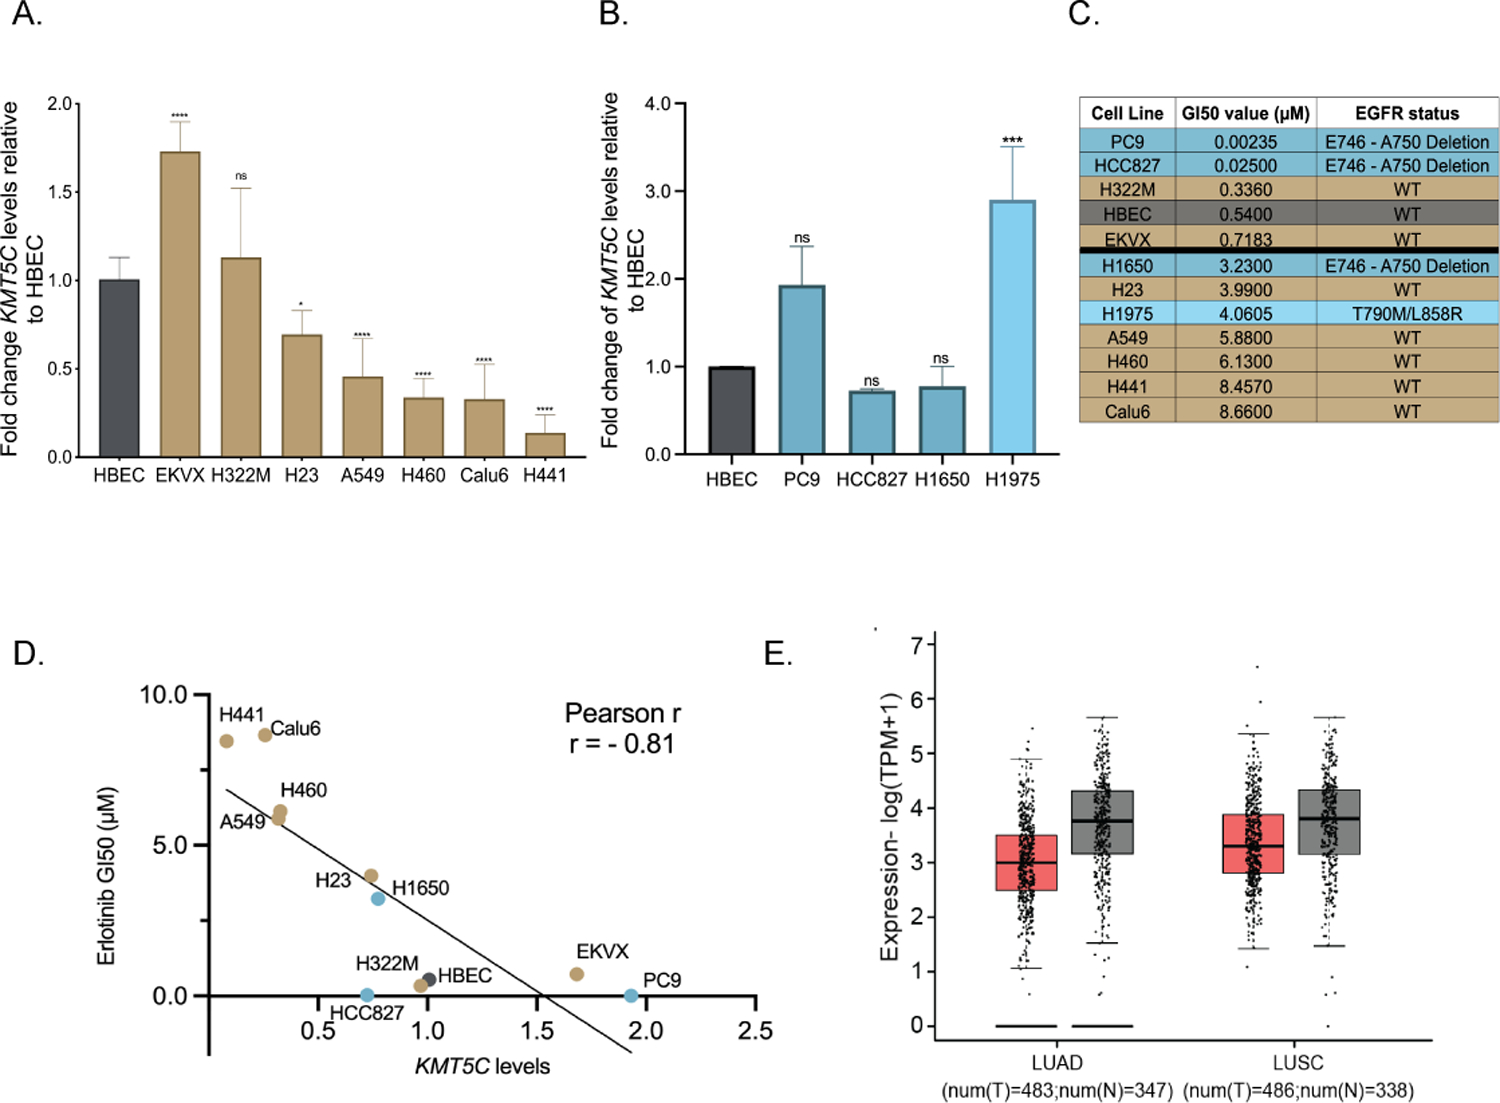
Figure 2: Reduced KMT5C transcript correlates with erlotinib resistance in NSCLC cells, and poor prognosis in NSCLC patients.

Expression of KMT5C in NSCLC cells A) represented in the DTP or B) with mutation(s) in EGFR, relative to a non-tumorigenic lung epithelial cell line (Human Bronchial Epithelial Cells, HBEC), evaluated by qRT-PCR. Data are normalized to GAPDH and relative to HBEC. One-way ANOVA followed by Dunnett’s Multiple Comparison test was used to evaluate statistical significance. Color of bars represents EGFR mutation status: gold, EGFR wt; dark teal, EGFR primary mutation; light teal, EGFR secondary mutation. C) Erlotinib dose response evaluated by exposing cell lines to varying concentrations of erlotinib or the highest equivalent volume of DMSO containing media for 72 hours followed by SRB assay. GI50 concentrations of erlotinib were calculated from respective dose curve. D) Correlation analysis between KMT5C transcript from A/B and GI50 erlotinib concentrations from C. E) GEPIA analysis for KMT5C transcript levels in normal (grey bars) and tumor samples (pink bars) from LUAD and LUSC data obtained from The Cancer Genome Atlas (TCGA) and the Genotype-Tissue Expression (GTEx) databases. TPM= Transcripts per million, T= Tumor, N=Normal.
