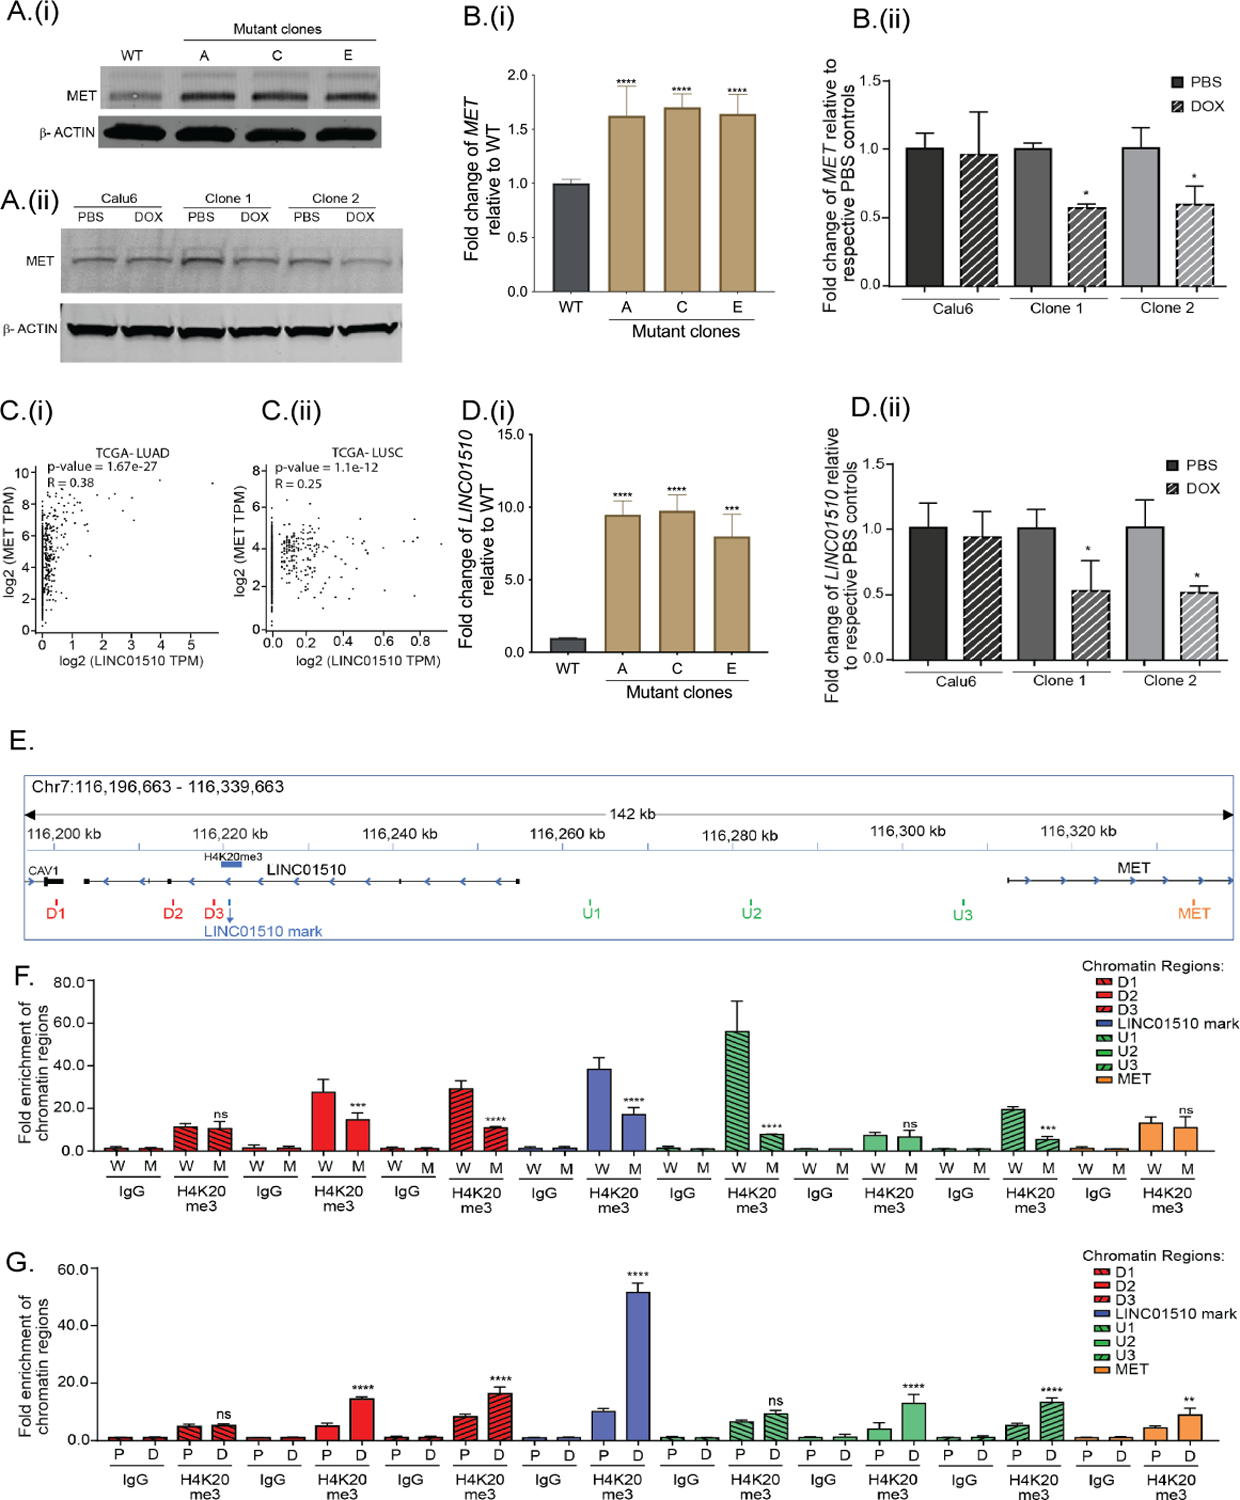
Figure 6: KMT5C represses LINC01510 and MET via H4K20me3.

A) Representative western blot of MET in (i) EKVX KMT5C WT cells and mutant clones, and (ii) Calu6 cells and clones stably expressing a DOX-inducible KMT5C vector. B) qRT-PCR data for MET in (i) WT cells and KMT5C mutant clones, or (ii) Calu6 cells and clones stably expressing a DOX-inducible KMT5C vector. C) Correlation analysis between LINC01510 and MET transcripts obtained from (i) LUAD and (ii) LUSC datasets, evaluated using GEPIA. D) Expression of LINC01510 in (i) KMT5C mutant lines, or in (ii) KMT5C inducible clones. E) Diagram of the genomic region representing the predicted H4K20me3 modification on the LINC01510 gene body, upstream of MET, as identified from GSE59316. ChIP-qPCR primers designed on and around the H4K20me3 mark are indicated as LINC01510 mark, regions downstream (D1, D2, D3) and upstream (U1, U2, U3) of the H4K20me3 mark, and on MET. ChIP was performed on chromatin isolated from F) WT (W) or KMT5C mutant clone C (M), G) DOX inducible KMT5C cells following growth in DOX (D, induced) or PBS (P, uninduced). qPCR using the immunoprecipitated chromatin was conducted using primers depicted in E. Data is represented as fold enrichment of the chromatin region pulled-down by H4K20me3 primary antibody relative to IgG. Statistical significance is represented for fold enrichment of chromatin regions in KMT5C mutant clone C relative to WT, or DOX relative to PBS. For panels showing statistical significance, One-way ANOVA followed by Dunnett’s Multiple Comparison test was used. TPM= Transcripts per million.
