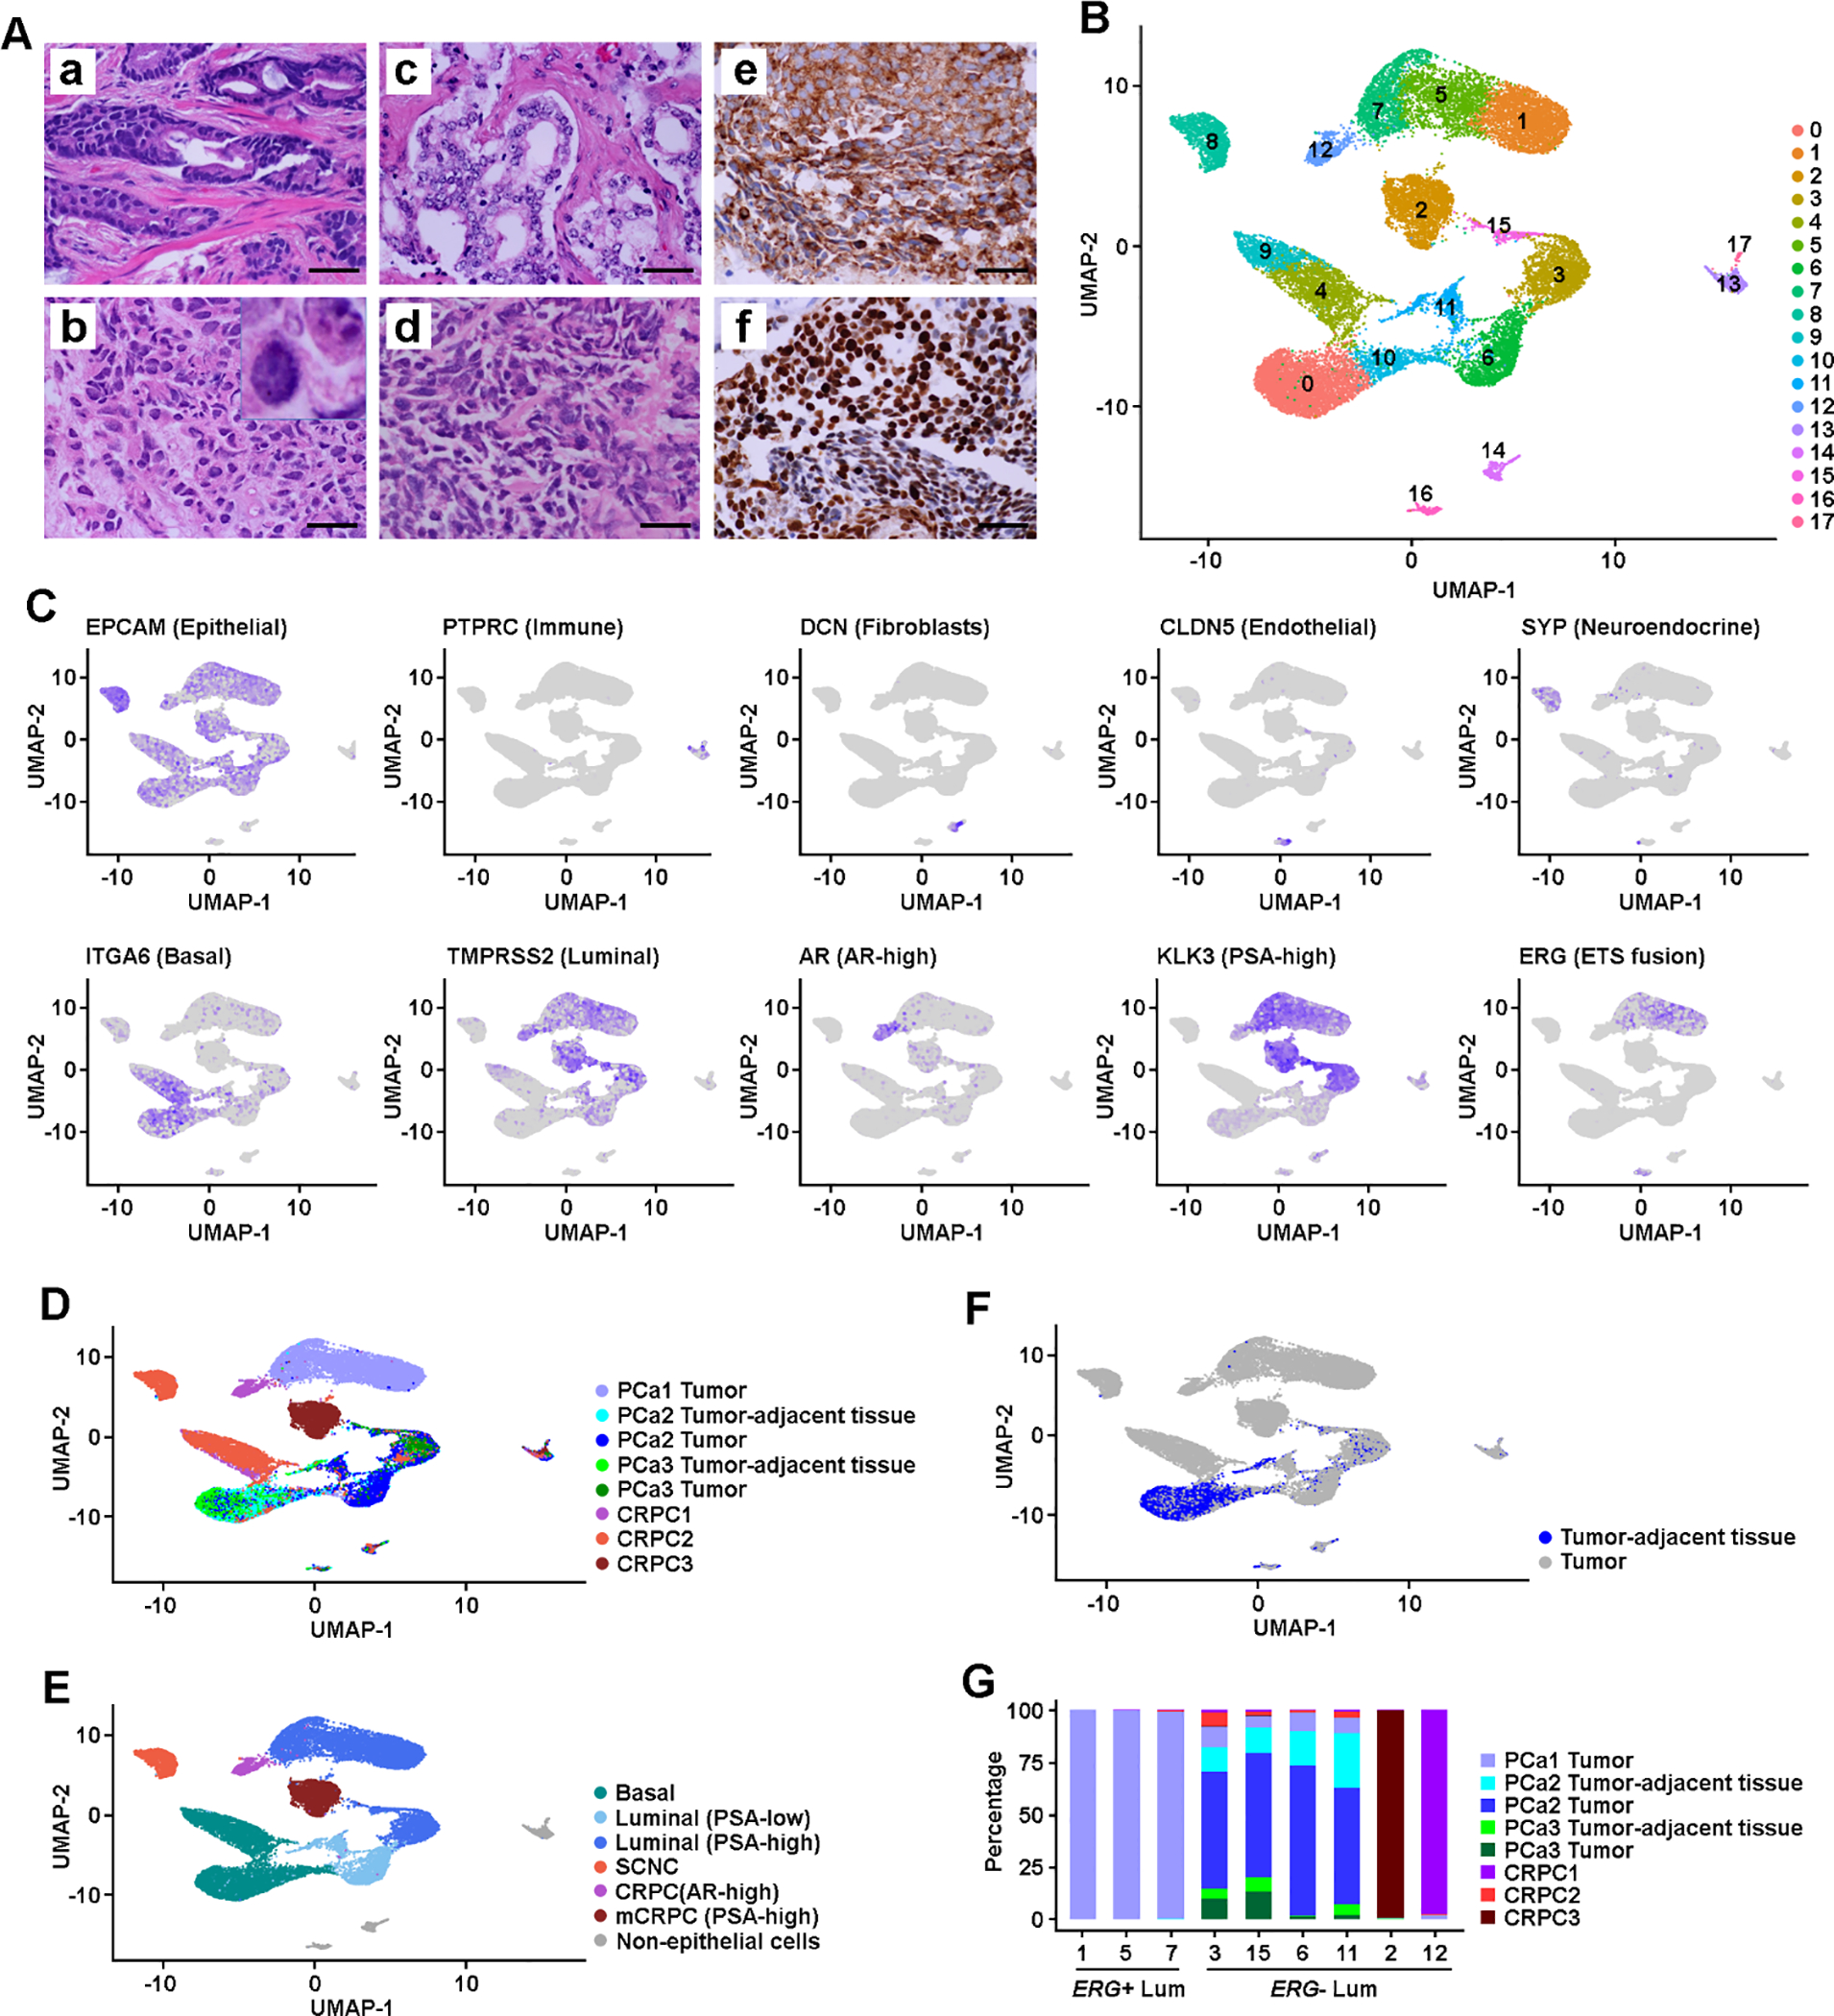
Fig. 1. Intratumoral heterogeneity in primary PCa and CRPC.

(A) Histology and IHC images: (a) Representative image of primary PCa (GS 4 + 3); (b) locally recurrent CRPC-adeno (the insert shows a higher magnification of tumor cells with nuclear features of adenocarcinoma); (c) Metastatic CRPC (mCRPC) to pelvic side wall, tumor shows classic features of CRPC-adeno; (d) locally recurrent PCa shows classic architectural and cytologic features of SCNC; (e) positive cytoplasmic staining of SCNC cells in (d) for the expression of an NE marker synaptophysin; and (f) positive nuclear staining of SCNC cells in (d) for the expression of an NE marker TTF-1. Scale bars in each panel are equal to 50 μm. (B) UMAP projection of expression profiles of 24 385 cells isolated from primary PCa and CRPC/SCNC samples. Dots represent single cells, colored by cell clusters. (C) Feature plots of cell type and lineage markers. Color represents expression level, from no expression (gray) to high level expression (dark blue). (D) UMAP view of cells colored by sample. (E) UMAP view of cells colored by lineage subtypes. Cell clusters were classified as basal, NE (in primary PCa), PSA-low and PSA-high luminal (in primary PCa), mCRPC with PSA-high, local CRPC with AR-high, SCNC, and lymphocyte. (F) UMAP view of tumor-adjacent tissue cell distribution among the cell clusters. (G) Distribution of cells isolated from tumor-adjacent tissue, PCa, and CRPC/SCNC samples among luminal clusters. AR = androgen receptor; CRPC = castration-resistant prostate cancer; GS = Gleason score; IHC = immunohistochemical; Lum = luminal; NE = neuroendocrine; PCa = prostate cancer; PSA = prostate-specific antigen; SCNC = small cell neuroendocrine carcinoma; UMAP = uniform manifold approximation and projection.
