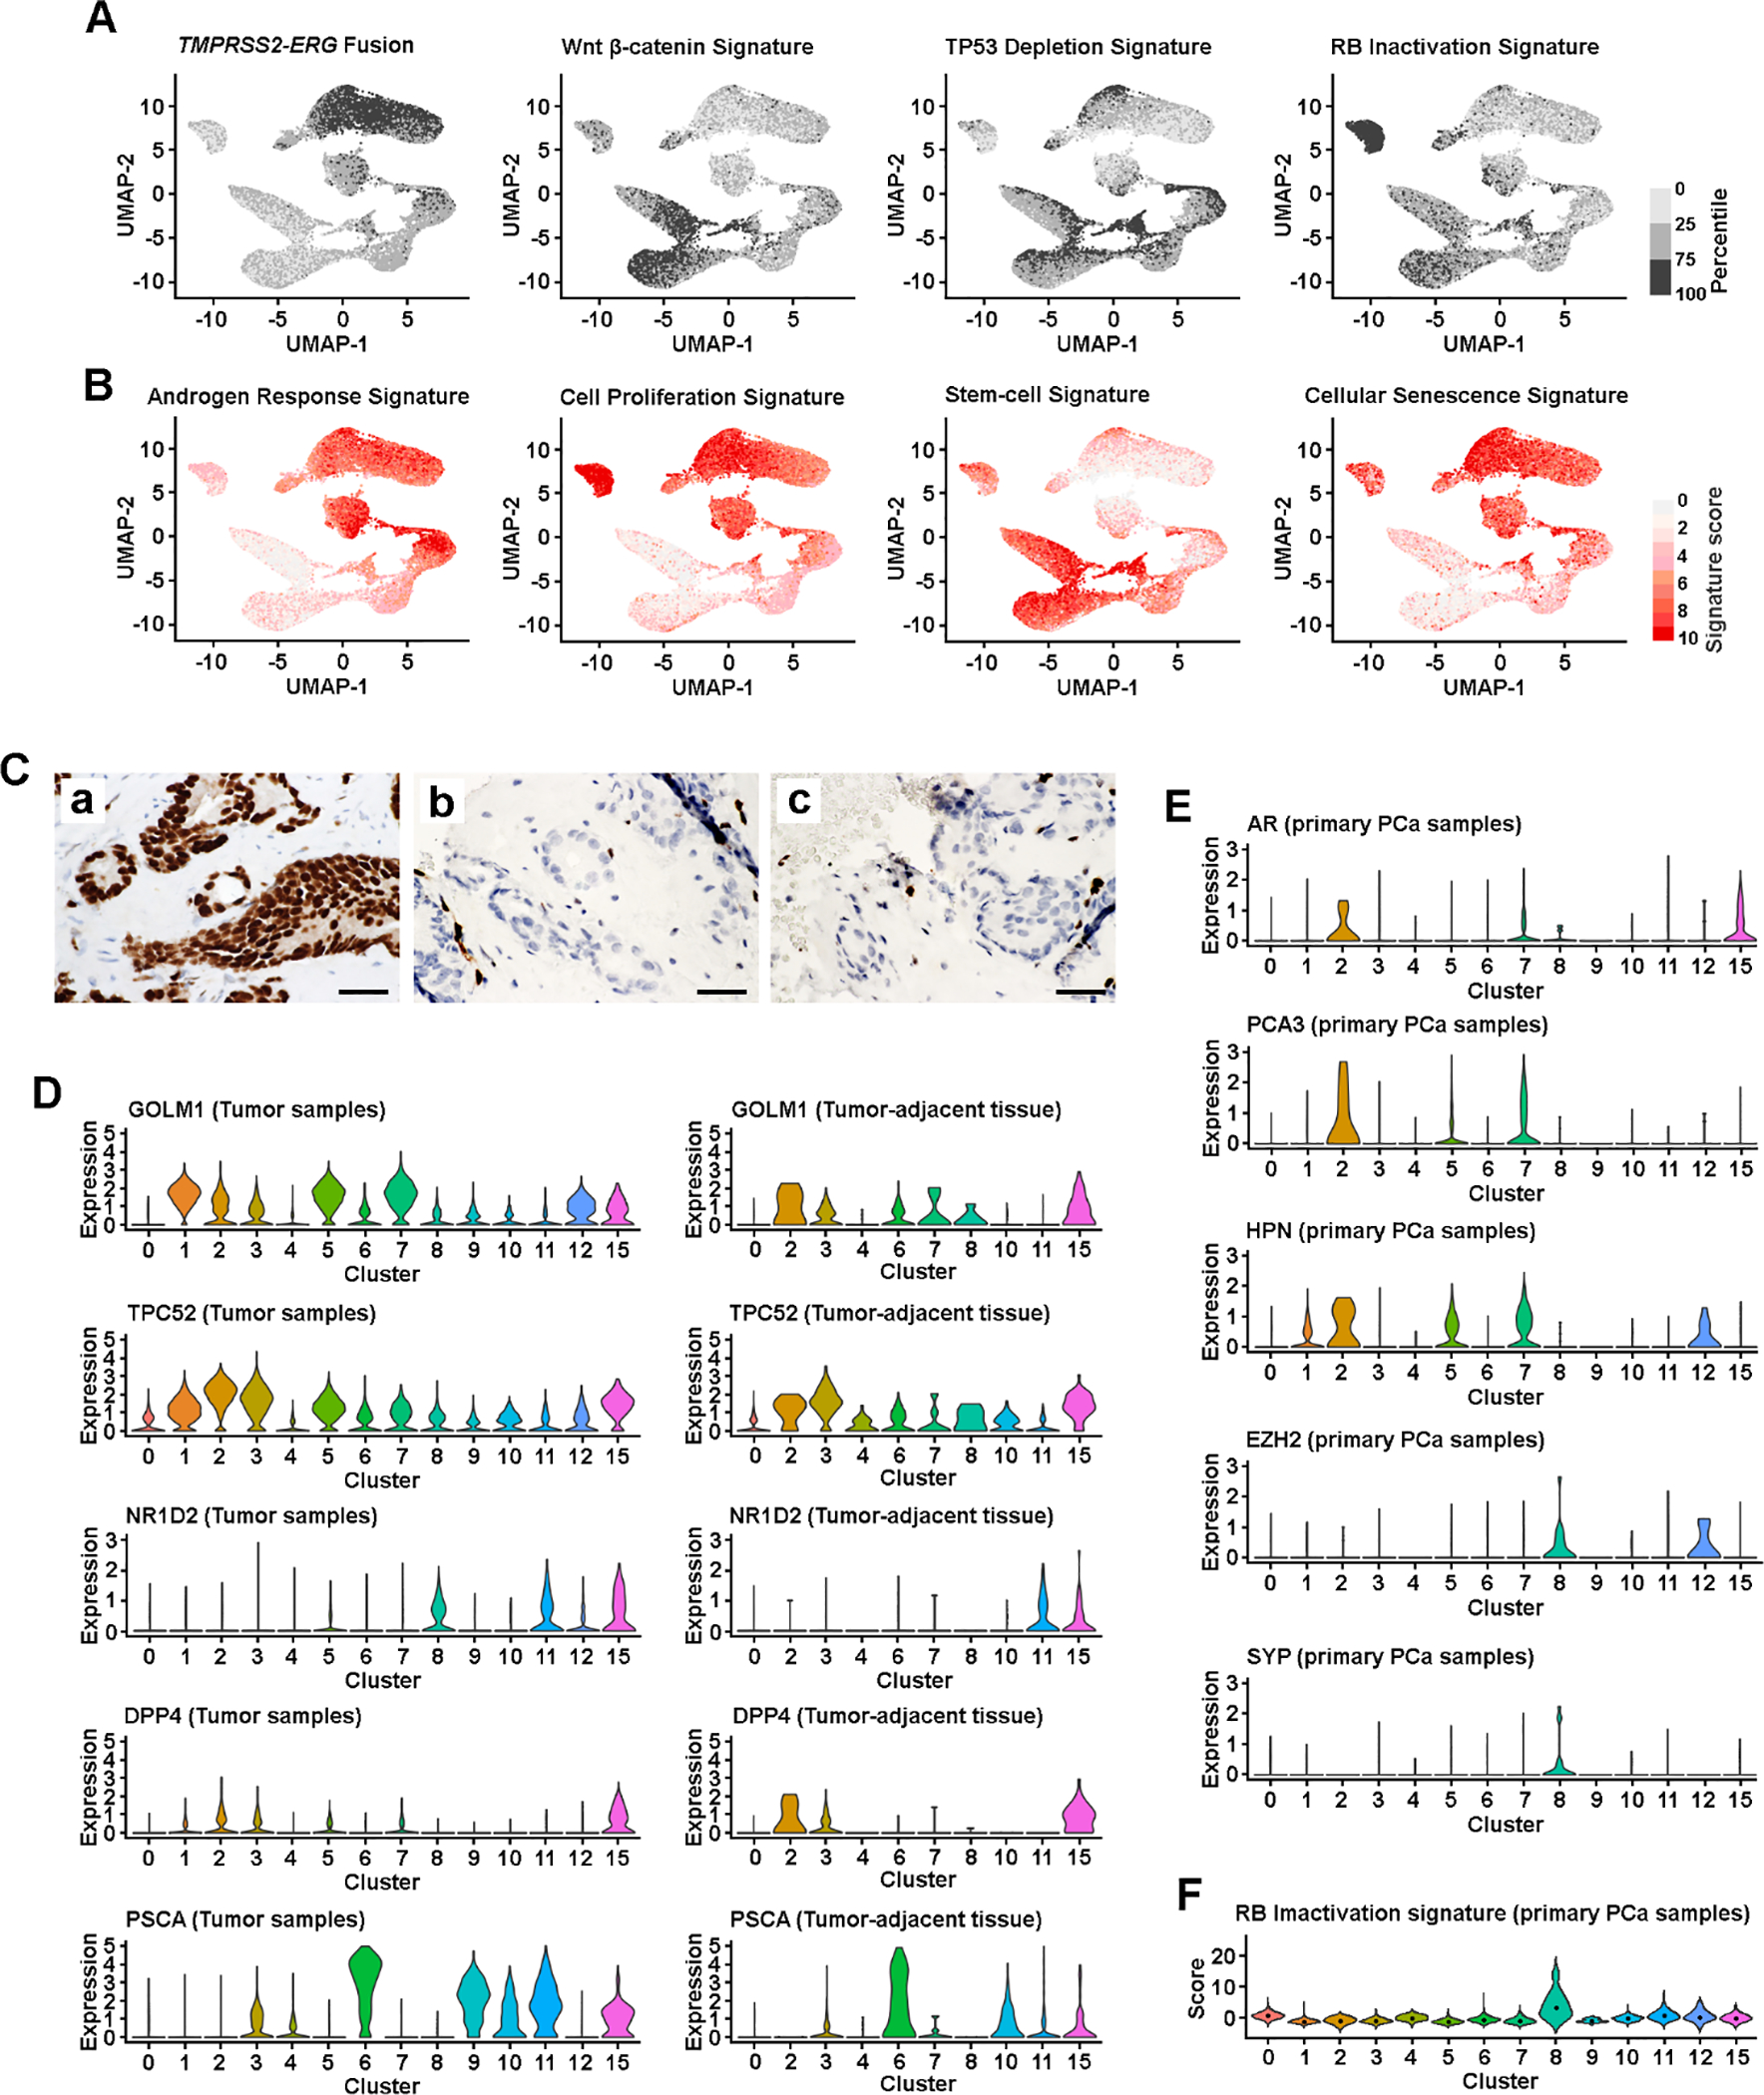
Fig. 2. Subtype-specific oncogenic signaling.

(A) UMAP view of cellular pathway signaling, colored by the quartiles of signature score. (B) UMAP view of cellular gene set signature scores. Color represents signature score level, from no expression (light gray) to high level expression (red). (C) Antibody-based IHC detection of ERG rearrangement: (a) PCa1 sample, (b) PCa2 sample, and (c) PCa3 sample. Scale bars in each panel are equal to 50 μm. (D) PCa markers defined subtype differences in tumor (both PCa and CRPC cells) and tumor-adjacent tissue. Violin plot visualized cellular gene expression within a cluster. Dot represents the median score level. (E) Lineage and PCa marker defined subtype differences among the cells isolated from primary PCa samples. (F) RB inactivation status among the cells isolated from primary PCa samples. Violin plot visualized the cellular signature score within a cluster. Dot represents the median score level. AR = androgen receptor; CRPC = castration-resistant prostate cancer; IHC = immunohistochemical; PCa = prostate cancer; SYP = synaptophysin.
