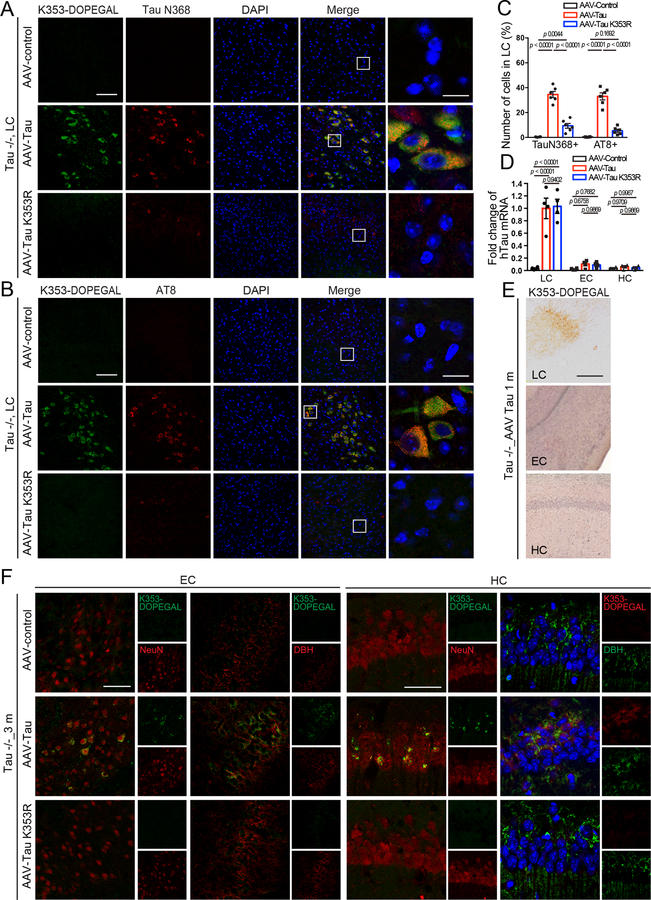
Extended Data Fig. 6. Tau K353R mutation blocks tau pathology spreading from the LC to the forebrain in Tau −/− mice.
AAV-control, AAV-Tau, and AAV-Tau K353R were injected into the LC of 3-month-old Tau −/− mice. The mice were assessed for Tau cleavage and phosphorylation 3 months after injection. A & B. Representative images of immunofluorescent staining for Tau K353-DOPEGAL (green); Tau N368 (red); DAPI (blue) (A) and Tau K353-DOPEGAL (green); AT8 (red); DAPI (blue) (B). Scale bars are 100 μm (left) and 20 μm (right). C. Quantification of Tau N368+ and AT8+ cells in the LC sections. Data are shown as mean ± SEM. n = 6 mice per group. Two-way ANOVA with Sidak’s multiple comparison. D. Quantitative PCR demonstrating the expression of human Tau in LC, EC, and HC at 3 months after viral injection. Data are shown as mean ± SEM. n = 4. Two-way ANOVA with Sidak’s multiple comparison. E. Representative images of immunohistochemistry staining for Tau K353-DOPEGAL on the LC, EC, and HC sections at 1 month after AAV-Tau injection into LC of Tau−/− mice. Scale bar is 200 μm. F. K353-DOPEGAL/NeuN or K353-DOPEGAL/DBH immunofluorescent co-staining on the EC or HC of Tau −/− mice. Tau K353-DOPEGAL (green)/NeuN or DBH (red); Tau K353-DOPEGAL (red)/ DBH (green)/DAPI (blue). Scale bar is100 μm. All images of E & F are representatives of three independent experiments with similar results.

