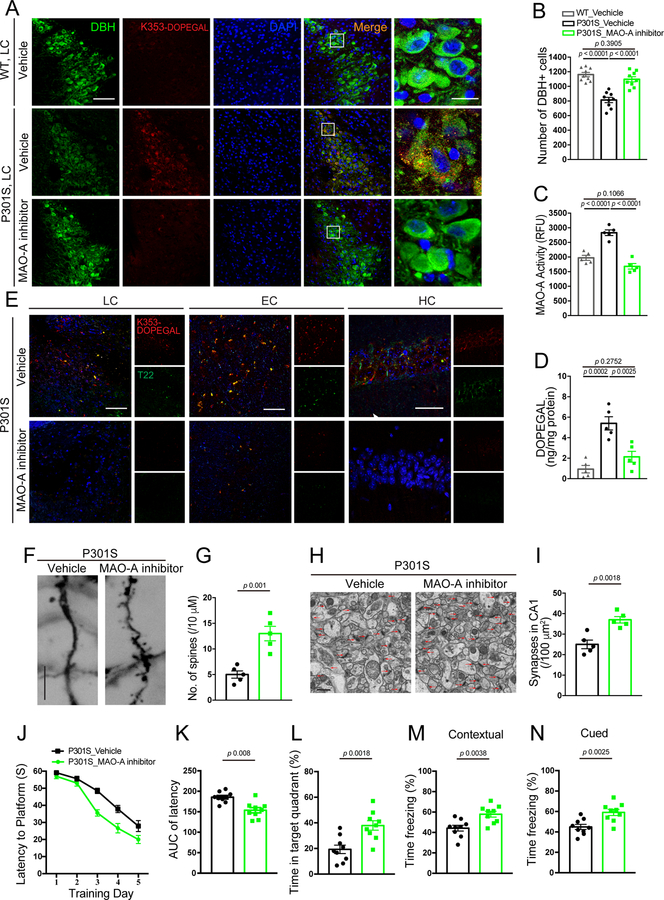
Figure 5. Inhibition of MAO-A reduces DOPEGAL-Tau modification and Tau pathology in Tau P301S mice.
MAO-A inhibitor, clorgyline, was administered in 3-month-old tau P301S mice for 3 months (3 mg/kg/day). A. Representative images of immunofluorescent staining for Tau K353-DOPEGAL (red), DBH (green), DAPI (blue) in the LC sections from WT or Tau P301S mice. Scale bars are 100 μm (left) and 20 μm (right). B. Quantification of DBH+ cells. C & D. MAO-A activity (C) and measurement of DOPEGAL (D) in the LC of vehicle- or clorgyline-administered tau P301S mice via enzymatic and HPLC analysis. Data are shown as mean ± SEM. n = 9 mice (B), n = 5 mice (C & D) per group. One-way ANOVA. E. Representative images of immunofluorescent staining for Tau K353-DOPEGAL (red), T22 (green), and DAPI (blue) in the LC, entorhinal cortex (EC), and hippocampus (HC) of vehicle- or clorgyline-administered tau P301S mice. All scale bars are 100 μm. F. Representative images of Golgi staining in CA1 region of vehicle- or clorgyline-administered tau P301S mice. Scale bar is 5 μm. G. Quantification of dendritic spines in Golgi staining of CA1 region. Data are shown as mean ± SEM. n = 5 mice per group. Student t-test. H. Representative electron microscopy images demonstrating the increase of synapses (red arrows) in CA1 region of clorgyline-administered tau P301S mice. Scale bar is 2 μm. I. Quantification of synaptic density in electron microscopy images of the CA1 region. Data are shown as mean ± SEM. n = 5 mice per group. Student t-test. J-L. Morris water maze test demonstrating that clorgyline alleviates cognitive impairment in tau P301S mice. Shown are latency travelled to the platform (J), area under the curve for total time travelled (K), and percent time spent in the quadrant platform during the probe trial (L). M & N. Fear conditioning test. Shown are the percentage of freezing time during the contextual fear (M) and cued fear (N). All data are shown as mean ± SEM. n = 9 mice per group. Student t-test with Welch’s correction.

