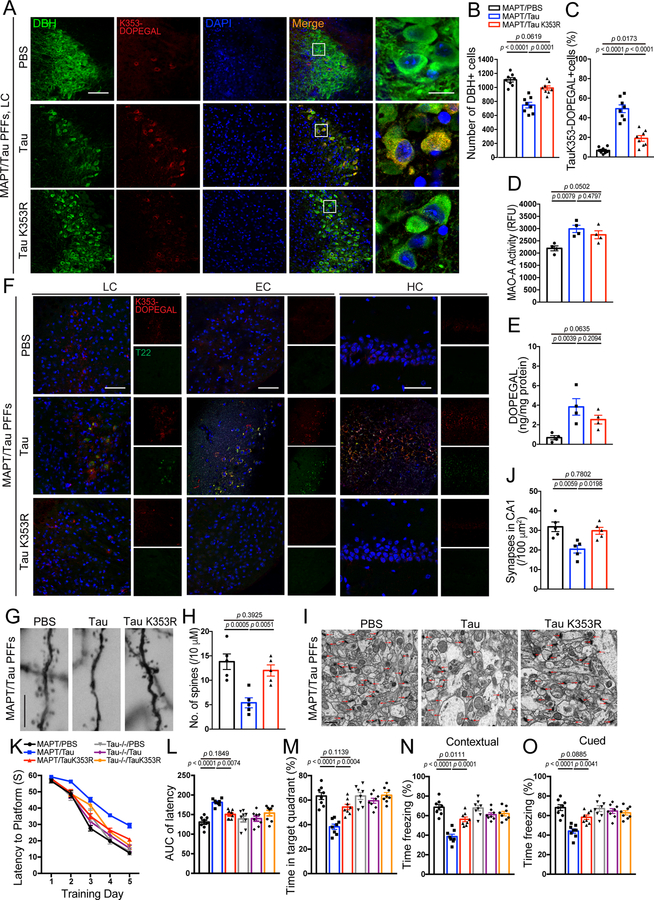
Figure 7. Mutation of K353R is resistant to tau fibrillization and propagation in MAPT mouse brain.
Preformed fibrils (PFFs) generated from wild-type and K353R mutant tau were injected into the LC of 3-month-old MAPT mice, and then mice were assessed for DOPEGAL-modified Tau pathology, propagation, and memory dysfunction 3 months after injection. A. Representative images of immunofluorescent staining for Tau K353-DOPEGAL (red), DBH (green), DAPI (blue) in the LC sections. Scale bars are 100 μm (left) and 20 μm (right). B & C. Quantification of DBH+ cells (B) and quantification of Tau K353-DOPEGAL+ cells (C) in the LC regions of Tau PFFs-injected MAPT mice. Data are shown as mean ± SEM. n = 8 per group. One-way ANOVA. D & E. MAO-A enzymatic activity (D) and the content of DOPEGAL (E) in the LC of PFFs-injected MAPT mice. Data are shown as mean ± SEM. n = 4 mice per group. One-way ANOVA. F. Representative images of immunofluorescent staining for Tau K353-DOPEGAL (red), T22 (green), and DAPI (blue) in the LC, entorhinal cortex (EC), and hippocampus (HC) of PFFs-injected MAPT mice. All scale bars are 100 μm. G. Representative images of Golgi staining in CA1 region of PFFs-injected MAPT mice. Scale bar is 5 μm. H. Quantification of dendritic spines in Golgi staining of CA1 region. Data are shown as mean ± SEM. n = 5 per group. One-way ANOVA. I. Representative electron microscopy images demonstrating the change of synapses (red arrows) in CA1 region of PFFs-injected MAPT mice. Scale bar is 2 μm. J. Quantification of synaptic density in electron microscopy images of CA1 region. Data are shown as mean ± SEM. n = 5 mice per group. One-way ANOVA. K-O. Morris water maze test demonstrating the alleviated memory dysfunctions by Tau K353R mutation in Tau PFF-injected MAPT mice. Shown are latency travelled to the platform (K), area under the curve for total time travelled (L), and percent time spent in the quadrant platform during the probe trial (M). N & O. Fear conditioning test. Shown are the percentage of freezing time during the contextual fear (N) and cued fear (O) tests following fear conditioning. All data are shown as mean ± SEM. n = 8 per group. One-way ANOVA.

