Figure 4:
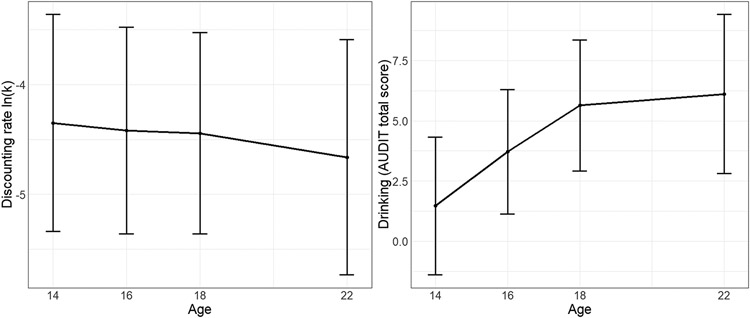
Left panel: Average development for discounting rate ln(k) measured by the Monetary Choice Questionnaire. Right panel: Average development of drinking measured by the Alcohol Use Disorder Identification Test (AUDIT). According to the latent growth curve model, discounting is decreasing and drinking is increasing over time. Error bars represent standard deviations.

