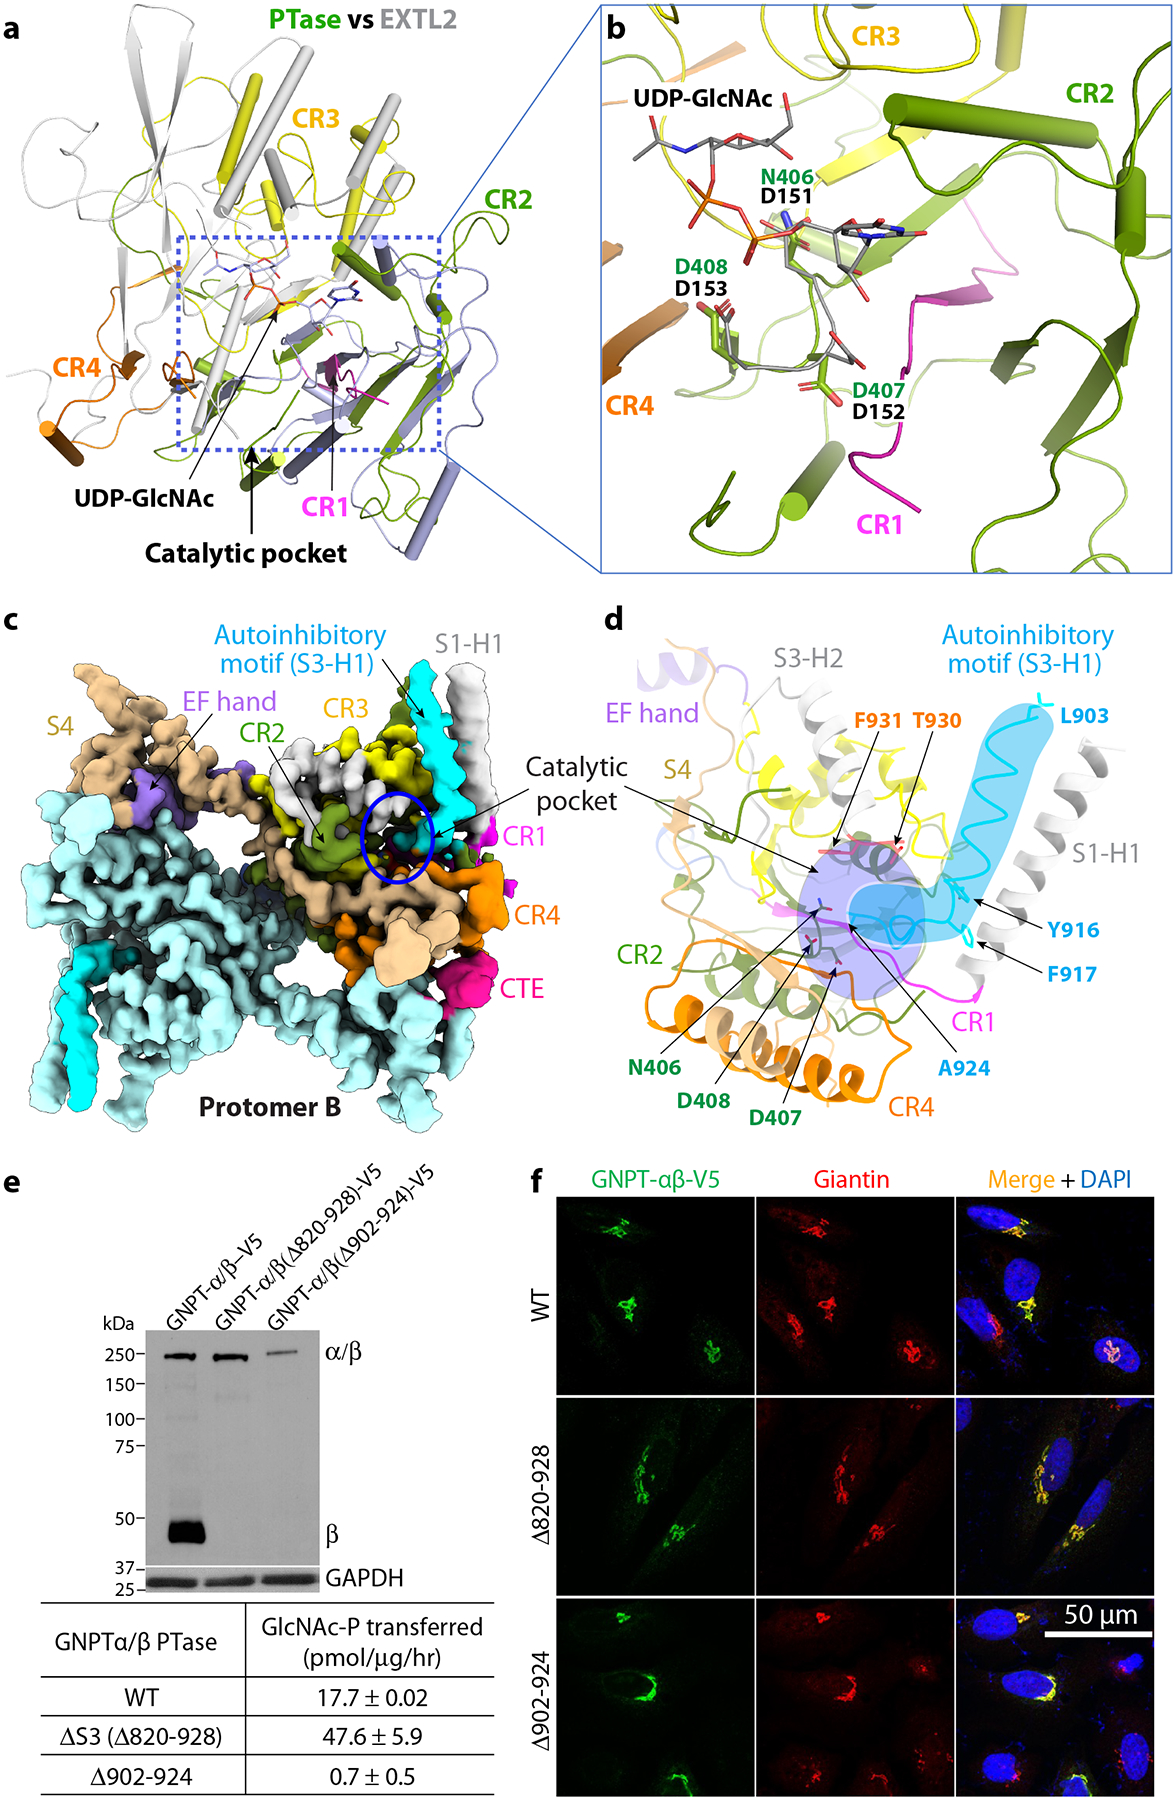
Figure 3. The catalytic pocket and the autoinhibited motif of PTase.

a) Superimposition of PTase and mEXTL2. The catalytic core of PTase is colored as in Fig. 1, with CR1-4 in magenta, olive drab, yellow, and orange, respectively. mEXTL2 structure (PDB ID 1ON6) is in gray. b) Close-up view of the UDP-sugar binding subdomain. The DDD motif and UDP-GlcNAc in mEXTL2 and the NDD motif in PTase are showed as sticks. c) Cryo-EM 3D map of human PTase in the autoinhibited state at 3.3 Å resolution. Domains are colored using the same color scheme as Fig. 1. For subunit A, CR1-4 are in magenta, olive drab, yellow and orange, respectively. EF hand in purple, S4 in wheat and CTE in pink. Subunit B is in pale cyan. The autoinhibitory motif (903–924) is in cyan. d) Close-up view of the autoinhibitory motif in the active pocket. The catalytic motif N406-D407-D408 and residues lining the pocket (T930 and F931) are shown in sticks. The cyan shape highlights the autoinhibitory motif, and the purple oval highlights the catalytic pocket. e) Upper panel: Immunoblot of the mock, WT, Δ820–928 and Δ902–924 constructs transfected into HEK 293 cells and probed with a monoclonal antibody against the V5 tag. 5 μg of each cell lysate was loaded. Lower panel: PTase activity of the WT and mutants expressed in HEK 293 and assayed using the model acceptor α-methylmannoside. The data shown are the mean ± SD for 4 independent experiments. f) Immunofluorescence microscopy of transfected HeLa cells showing Golgi localization of WT PTase and the deletion mutants. Uncropped images and data for graph in e are available as source data.
