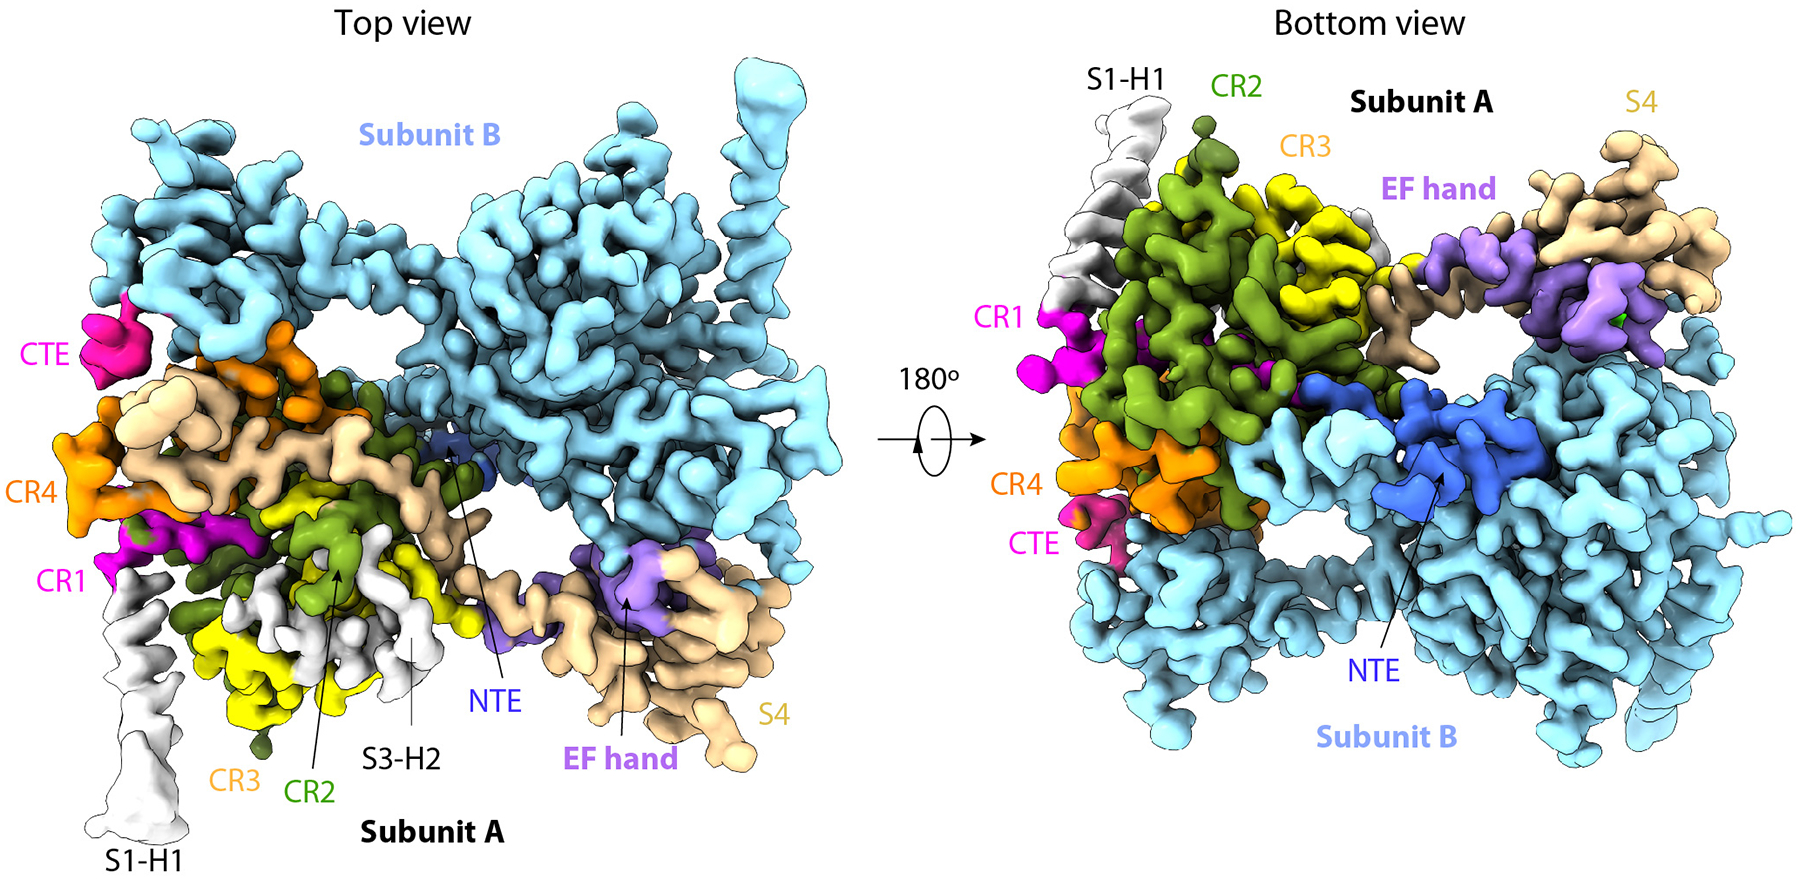
Extended Data Fig. 2. Cryo-EM 3D map of the core region of the human PTase.

Top and bottom views of the density map with the NTE, CR1-4, EF hand, S4, CTE, and the two resolved helices in S1 and S3 in subunit A colored in blue, magenta, olive drab, yellow, dark orange, purple, wheat, pink, and gray, respectively. Subunit B is in cyan.
