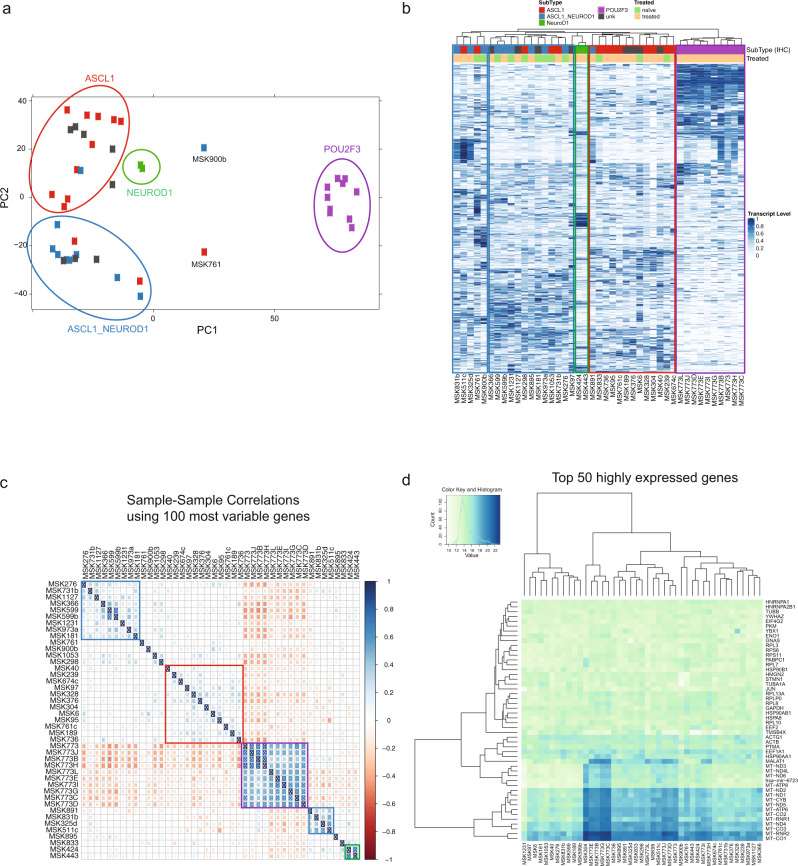
Fig. 4. Transcriptional profile analysis of SCLC tumors of different subtypes.
a Principal component analysis plot showing 43 patient-derived xenograft (PDX) samples color-coded based on immunohistochemistry (IHC) subtype annotation. Circles indicate four separate clusters (ASCL1-driven cluster, red; ASCL1/NEUROD1-driven cluster, blue; NEUROD1-driven cluster, green; POU2F3-driven cluster, purple). Source data are provided as a Source Data file. b Unbiased hierarchical clustering of 43 PDX samples. Color-coded panel on top depicts treatment status (naïve or treated) and subtype annotation based on IHC. Boxes indicate five separate clusters (two ASCL1/NEUROD1-driven clusters, blue; one NEUROD1-driven cluster, green; one ASCL1-driven cluster, red; one POU2F3-driven cluster, purple). Source data are provided as a Source Data file. c Sample-sample correlation plot using the top 100 highest variance genes. The Spearman correlation was used and the samples were ordered using hierarchical clustering with complete linkage. Five clusters emerged and are boxed (two ASCL1/NEUROD1-driven clusters, blue; one NEUROD1-driven cluster, green; one ASCL1-driven cluster, red; one POU2F3-driven cluster, purple). Source data are provided as a Source Data file. d Heatmap of the top 50 highly expressed genes in 43 PDX samples. Blue indicates high expression and green indicates low expression. Color key and histogram represents the normalized log 2-transformed counts. Source data are provided as a Source Data file.

