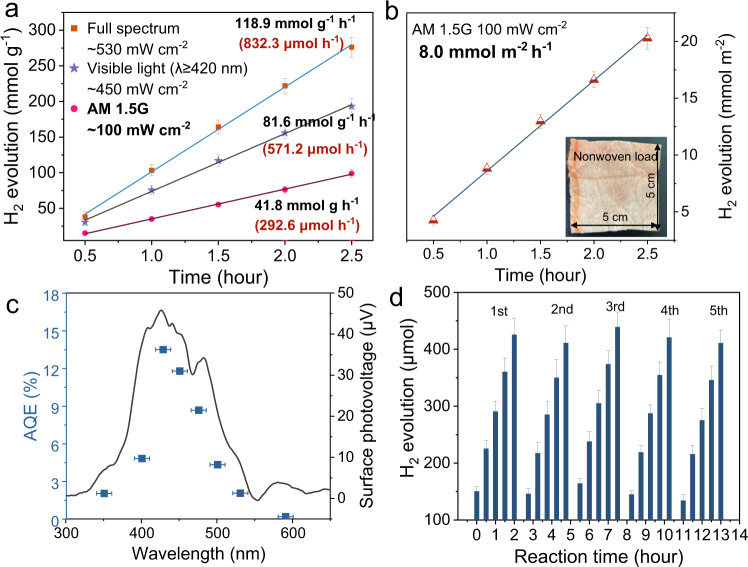
Fig. 2. Photocatalytic hydrogen evolution.
a Photocatalytic HER under full spectrum (λ ≥ 300 nm, light intensity: ∼530 mW cm−2), visible light (λ ≥ 420 nm, light intensity: ∼450 mW cm−2) and AM 1.5 G, (100 mW cm−2) of PTA nanosheets. b AM 1.5 G (100 mW cm−2) HER performance of PTA (2 mg) loaded on nonwoven fabrics, inset: optical image of PTA loaded on nonwoven devices. (All error bars are determined from three independent experiments). c The wavelength-dependent AQE for photocatalytic HER over PTA and the surface photovoltage of PTA. (The error bar came from a bandpass filter). d The cycle photocatalytic HER performance of PTA under the full spectrum. Reaction conditions: 7.0 mg photocatalyst, 4.6 wt. % Pt as a cocatalyst, 100 mL of a 0.2 M ascorbic acid solution, pH 2.45. (All error bars were determined from three independent experiments).

