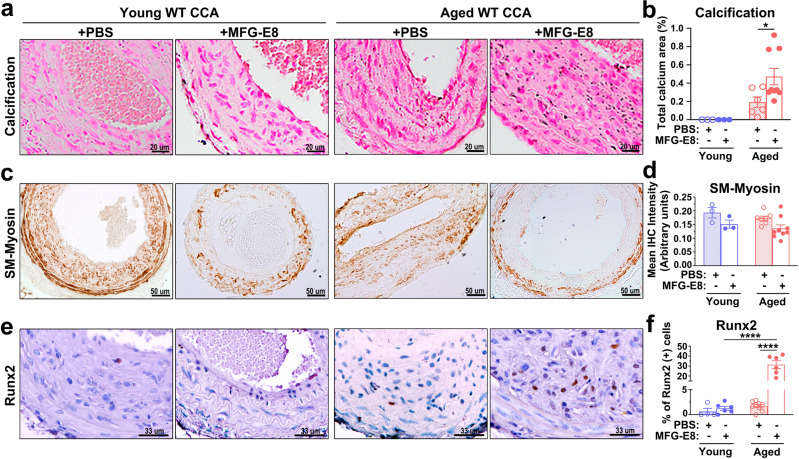
Fig. 3. Exogenous application of milk fat globule–epidermal growth factor 8 (MFG-E8) promotes the vascular calcification and osteogenic transdifferentiation of vascular smooth muscle cells in aged mice.
Common carotid arteries (CCAs) of young and aged wild-type (WT) mice were ligated to induce vascular remodeling. Pluronic gel containing phosphate-buffered saline (PBS) or rMFG-E8 was applied on CCAs immediately after the ligation. a, b Paraffin sections of ligated CCAs 21 days postligation were subjected to von Kossa staining. a Representative images of CCA sections from four groups of mice indicating calcium deposition in the arterial walls. b Quantification of calcified area in the arterial walls (Young + PBS: nmice = 3, Young+MFG-E8: nmice = 3, Aged+PBS: nmice = 6, Aged+MFG-E8: nmice = 9). Results are presented as mean ± standard error of the mean (SEM). Each data point is derived from an assessment of three sections of one individual animal. *P < 0.05, as obtained using one-way analysis of variance (ANOVA) followed by Tukey’s multiple comparisons test. c Representative immunohistochemistry (IHC) images of smooth muscle myosin (SM-Myosin) in the CCAs of mice 21 days after ligation. Scale bar: 50 μm. d Quantitative analysis of the immunostaining intensities of SM-Myosin in the intimal medial area was performed (Young + PBS: nmice = 3, Young+MFG-E8: nmice = 3, Aged+PBS: nmice = 7, and Aged+MFG-E8: nmice = 9). Data are presented as mean ± SEM. Each data point was derived from an assessment of three sections from one individual animal. e Representative IHC photomicrographs of runt-related transcription factor 2 (Runx2) in the ligated CCAs 21 days after surgery. Scale bar: 33 μm. f Quantitative IHC analysis of the percentage of Runx2-positive cells over the total cell number in the intimal medial area (Young + PBS: nmice = 4, Young+MFG-E8: nmice = 6, Aged+PBS: nmice = 9, and Aged+MFG-E8: nmice = 6). Data are presented as mean ± SEM. Each data point was derived from an assessment of three sections from one individual animal. ****P < 0.0001, obtained using one-way ANOVA followed by Tukey’s multiple comparisons test.

