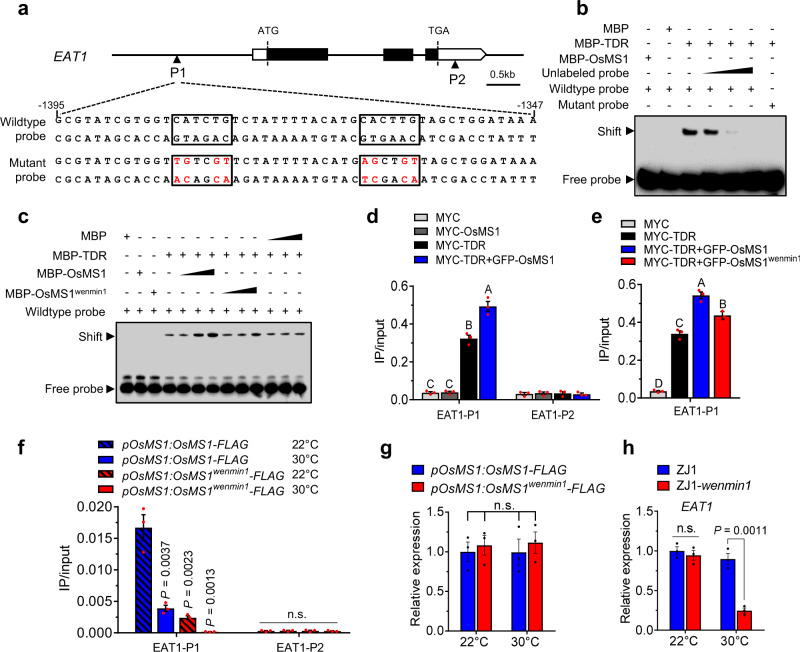
Fig. 5. OsMS1 enhances the binding of TDR to the EAT1 promoter.
a Schematic representation of partial structure of the EAT1 locus. The conserved E-box elements (CANNTG) are shown in black boxes. The mutated sequences are shown in red. P1 and P2 represent DNA fragments used for ChIP-qPCR analysis. P1 fragment contains two E-box elements, while P2 fragment contains no E-box element. b EMSA assay reveals that TDR but not OsMS1 directly binds to the EAT1 promoter in vitro. The wild-type and mutated probes were shown in (a). MBP was used as a negative control. 10-, 20-,100-fold excess unlabeled probes were used as competitors. c EMSA assay showing the effects of OsMS1 and OsMS1wenmin1 on the binding of TDR to the E-box elements in the EAT1 promoter in vitro. Biotin-labeled probes were incubated with a constant amount of MBP-TDR protein with increasing amounts of MBP-OsMS1, MBP-OsMS1wenmin1 or MBP. MBP was used as a negative control. d, e ChIP-qPCR assays showing the effects of OsMS1 and OsMS1wenmin1 on the binding of TDR to the EAT1 promoter in rice leaf protoplasts (n = 3 biological repeats). Chromatins were incubated with anti-MYC antibody, and precipitated by protein A + G magnetic beads. ChIP-qPCR results were quantified by normalization of the MYC-IP signal with the corresponding input signal (IP/input), and different letters represent significant differences (P < 0.01; Duncan’s multiple range test). f Temperature-dependent enrichment of OsMS1 and OsMS1wenmin1 at the EAT1 promoter by ChIP assays in rice stage 9 anthers. pOsMS1:OsMS1-FLAG and pOsMS1:OsMS1wenmin1-FLAG transgenic lines were grown at 22 °C or 30 °C in growth chamber. Chromatins were incubated with anti-FLAG antibody, and precipitated by protein A + G magnetic beads. ChIP-qPCR results were quantified by normalization of the FLAG-IP signal with the corresponding input signal (IP/input). P values indicate the significant differences relative to pOsMS1:OsMS1-FLAG at 22 °C. g mRNA levels of OsMS1-FLAG and OsMS1wenmin1-FLAG in (f). h qPCR analysis of EAT1 expressions in ZJ1 and ZJ1-wenmin1 stage 9 anthers. ZJ1 and ZJ1-wenmin1 were grown at 22 °C or 30 °C in growth chamber. For d–h, values are means ± s.e.m. (n = 3 biological repeats). For f–h, two-tailed unpaired t-test was used for statistical analysis. n.s., not significant. Experiments in b and c were repeated three times with similar results. Source data are provided as a Source data file.

