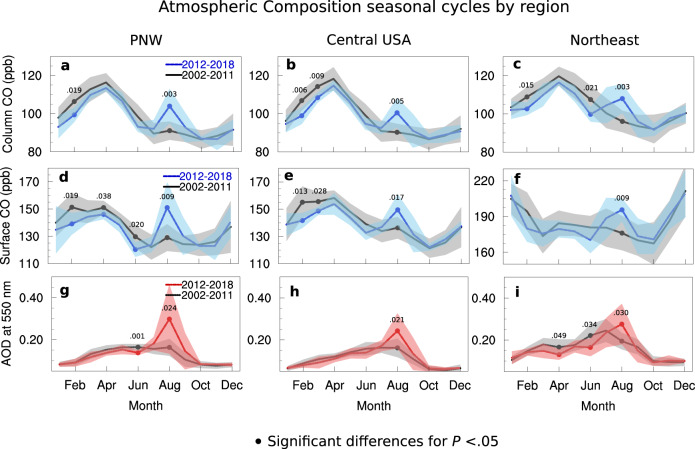
Fig. 3. Seasonal patterns of atmospheric composition.
Regional seasonal patterns of atmospheric composition are shown for two different time periods: 2002–2011 (black line with gray shading) and 2012–2018 (blue or red). a–c Measurements of Pollution in the Troposphere (MOPITT) carbon monoxide (CO) as column average volume mixing ratio (VMR) in parts per billion (ppb). d–f MOPITT surface CO VMR. g–i Moderate Resolution Imaging Spectroradiometer (MODIS) aerosol optical depth (AOD). Regions are the Pacific Northwest (PNW), Central USA, and the Northeast. The shaded area shows the standard deviation and filled circles represent data means that are significantly different between the two time periods with P values noted for a two-tailed t-test. More complete statistics relevant for the August differences can be found in Table 1. The Northern Hemisphere background CO trend 2002–2018 of −0.50 ppb per year was removed prior to seasonal cycle calculation for (a)–(f).

