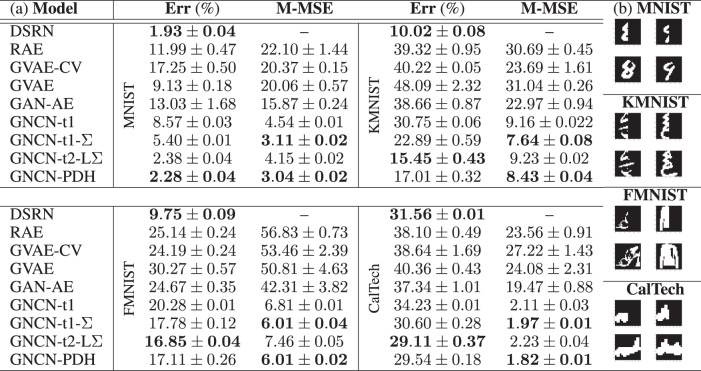
Table 2.
Downstream performance across datasets.
(a) The classification error (Err) of a log-linear model fit to each model’s latent codes and the masked mean squared error (M-MSE) of the model’s pattern completion ability on the test set are reported (lower is better—the two best scores are shown in bold font with respect to each metric/column). Metrics are averaged over 10 trials—we report their mean and standard deviation. (b) For each database, we present for MNIST, KMNIST, FMNIST, and CalTech (in order from top to bottom) two randomly selected image patterns (from each dataset’s training split), which are shown in the first row of each dataset’s table, and the GNCN-PDH’s completion of these patterns, displayed in the second row of each dataset’s table (note that GNCN-t1-Σ is the same as GNCN-t1-Σ/Friston and GNCN-t1 is the same GNCN-t1/Rao.).

