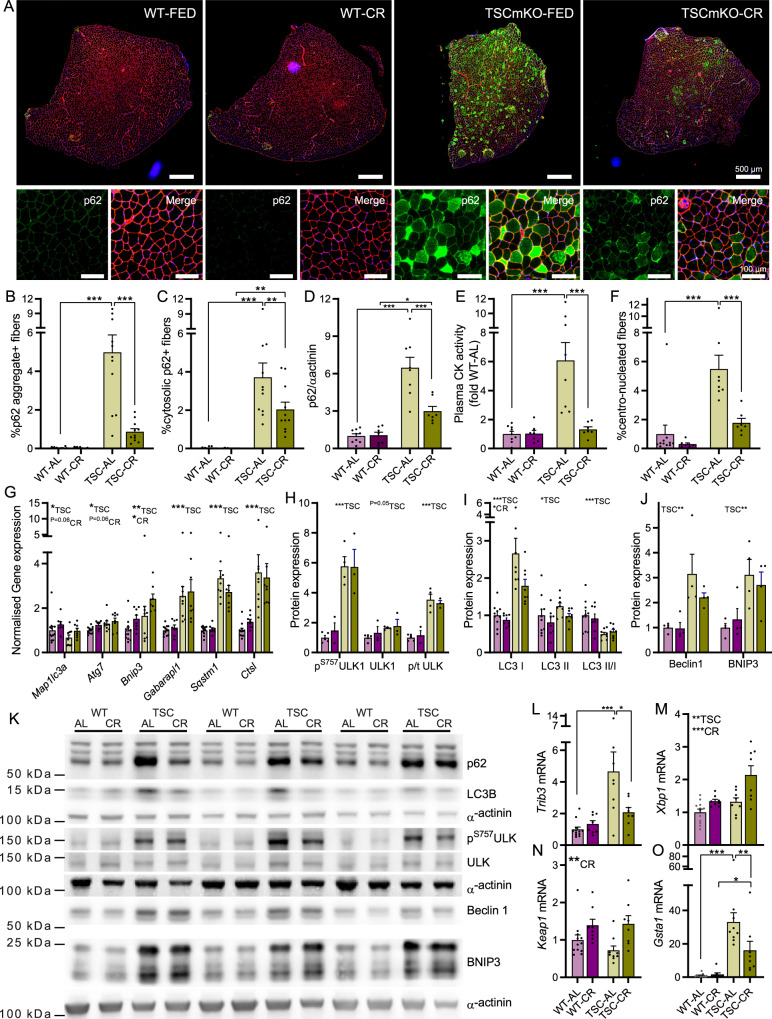
Fig. 5. CR attenuates p62 accumulation and improves muscle integrity in TSCmKO mice.
A Representative tibialis anterior (TA) cross sections stained with antibodies against p62 and laminin and counterstained with DAPI. Quantification of fibers with B p62+ aggregates and C p62+ cytosolic staining. D Western blot quantification of p62 protein expression in gastrocnemius muscle. E Plasma creatine kinase activity and F percentage centro-nucleated fibers in WT-AL, WT-CR, TSC-AL and TSC-CR mice. G RT-qPCR analysis of autophagy associated genes in gastrocnemius muscle. Western blot quantification of the abundance of H phosphorylated and total ULK1 protein, I LC3I, LC3II and the ratio of LC3II to I, and J beclin1 and BNIP3 protein as well as K representative gels. Two and three independent blots were performed for p62 and LC3B, respectively. RT-qPCR analysis of ER-stress and autophagy interacting genes, including L Trib3, M Xbp1, N Keap1, and O Gsta1. For B, C, n = 15, 12, 11, 11; for D, E, n = 9, 7, 8, 7; for F, n = 11, 7, 8, 7; for G and N, O n = 12, 8, 9, 8; for H, n = 5, 3, 4, 3; for I, n = 10, 8, 8, 8; for J, n = 4, 4, 4, 4, for L, M, n = 12, 8, 8, 8 and; for N, O, n = 12, 8, 9, 8 for WT-AL, WT-CR, TSC-AL, and TSC-CR, respectively. Data are presented as mean ± SEM. Two-way ANOVAs with Tukey post hoc tests were used to compare data. *, **, and *** denote a significant difference between groups of P < 0.05, P < 0.01, and P < 0.001, respectively. #Denotes a trend where 0.05 < P < 0.10. Colored asterisks refer to the group of comparison.

