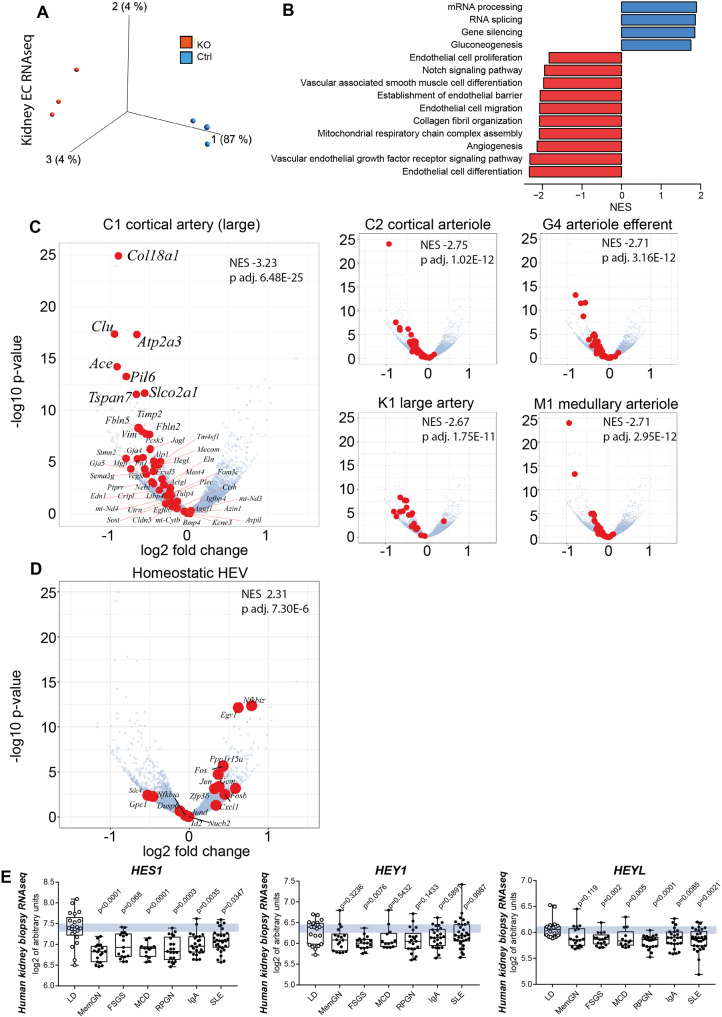
Fig. 5. Kidney endothelial cell RNAseq and gene set enrichment analysis (GSEA).
A Principal Component Analysis of RbpjΔEC vs. Control kidney EC transcription analysis, n = 3/group, (Variance filtering 0.05, Student’s T test followed by the B-H correction (p < 0.02, FDR < 0.0199731) showing biological replicates of each group clustering together (370 genes) (more information in “Methods”). B GO-term GSEA—selected significantly up- (red) and downregulated (blue) gene sets sorted by normalized enrichment score (NES). C Volcano plots of individual genes with expression changed in RbpjΔEC compared to control, with log2 (fold change) on x-axis and –log10 (adjusted p-value) on the y-axis; in red, genes belonging to selected marker gene sets for different kidney arterial segments (from refs. 49,50). NES and p value upper right corners; see “Methods” (GSEA) for statistics. D Homeostatic HEC marker gene set from12 in red in same volcano plot, NES and p value upper right corner. See Methods (GSEA) for statistics. E Human kidney biopsy RNAseq (GSE: EC Notch target genes in different glomerular diseases downregulated as compared to living kidney donor biopsies as control. Abbreviations and sample number: LD, living kidney donor (n = 21); MemGN, membranous glomerulonephritis (n = 18); FSGS, focal segmental glomerulosclerosis (n = 17); MCD, minimal change disease(n = 13); RPGN, rapid-progressive glomerulonephritis (n = 21); IgA, Iga-Nephritis (n = 25); SLE, systemic lupus erythematodes (n = 32). Single samples (dot) plus mean, IQR (box) and total range (min-max: whiskers). Statistic: Brown-Forsythe and Welch (1 way) ANOVA with Dunnet’s multiple comparisons; exact adjusted p-values: HES1, compared to LD: MemGN <0.0001; FSGS, 0.068; MCD, <0.0001; RPGN, 0.0003; IgA, 0.0035; SLE, 0.0347. HEY1, compared to LD: MemGN, 0.3236; FSGS, 0.0076; MCD; 0.5432; RPGN, 0.1433; IgA, 0.5891; SLE, 0.9987. HEYL, compared to LD: MemGN, 0.119; FSGS, 0.002; MCD, 0.0050; RPGN, < 0.0001; IgA, 0.0085; SLE, 0.0021. Source data are provided as supplementary files.

