Figure 2.
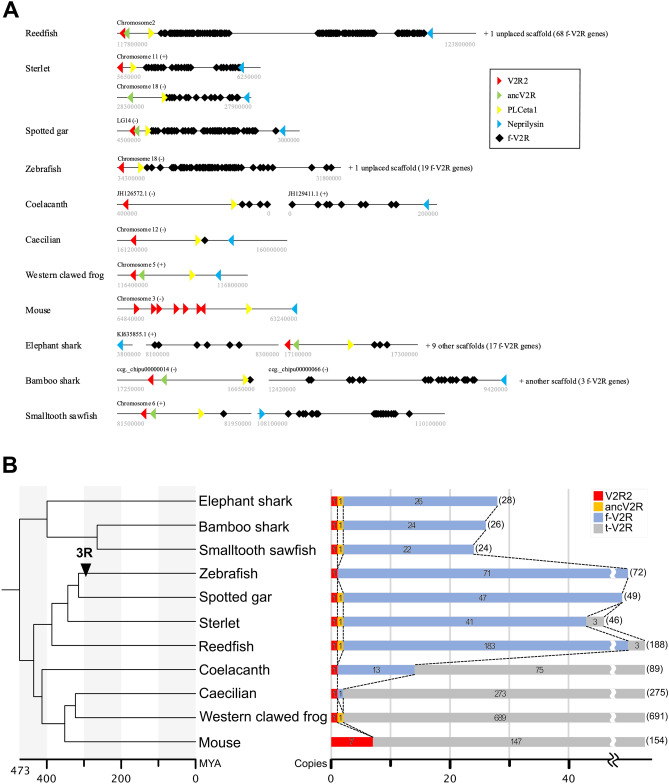
(A) Synteny relationships for the f-V2R clusters among basal ray-finned fish (reedfish, sterlet, spotted gar), teleost fish (zebrafish), lobe-finned fish (coelacanth), tetrapods (caecilian, western clawed frog, mouse), and cartilaginous fish (elephant shark, bamboo shark, and smalltooth sawfish), respectively. Triangles in yellow, blue, red, and green indicate two landmark genes (PLC eta1, neprilysin), V2R2, and ancV2R, respectively. Black squares indicate f-V2Rs. Indicated at the upper-left of each line were several chromosomes or scaffolds and its directions. Indicated below the ends of the line are the start and end of the cluster regions. Unplaced scaffolds are not shown in this figure. Note that f-V2Rs were flanked by two landmark genes and that V2R2s and ancV2Rs were located in tandem close to the clusters. No t-V2Rs were observed in these cluster regions. In the elephant shark, some f-V2Rs are located outside the cluster because the cluster regions were not properly assembled. (B) Changes in the number of V2Rs during vertebrate evolution. The phylogenetic tree with timescale for 11 representative vertebrates (left) and the number of V2Rs in these species (right) are shown. The timing of teleost-specific third round whole genome duplication (3R) is indicated by arrow. The color and number on the bar graph indicate the clade and copy number, respectively. The total copy number of V2Rs is shown in parentheses on the right of the graph. MYA: million years ago.

