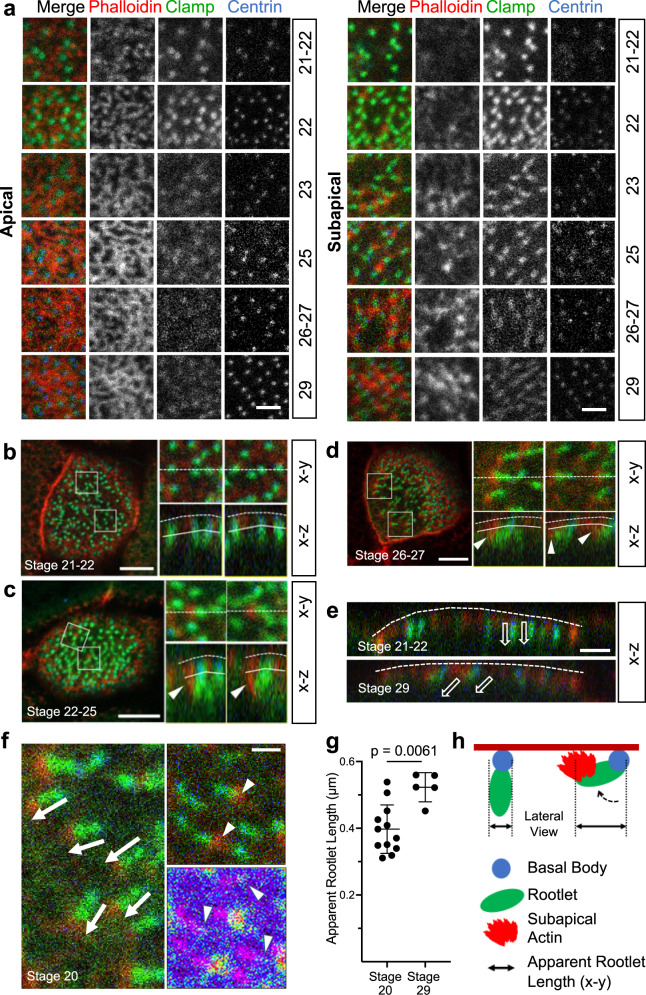
Fig. 1. Development of the subapical actin in multiciliated cells (MCCs).
a While the apical actin cytoskeleton reaches its final density by stage 25, the subapical actin continues to develop until stage 29 (scale bar, 2 µm). b Basal body (ciliary) rootlets, labeled with GFP-Clamp (green), are orthogonally aligned to the plasma membrane at stage 21-22. The right panels represent magnified insets marked by white squares. The dashed line depicts the apical plasma membrane, the solid line separates the apical and subapical actin layer (scale bar, 2 µm). c Actin filaments, labeled with phalloidin (red, white arrow heads) start originating from ciliary rootlets (GFP-Clamp) at stage 22–25. The right panels represent magnified insets marked by white squares (scale bar, 2 µm). d After nucleation of actin filaments (phalloidin, red), rootlets are tilted towards the apical plasma membrane at stage 26-27. The right panels represent magnified insets marked by white squares. The white arrowheads indicate subapical actin filaments, projecting toward the apical plasma membrane. The dashed white line depicts the apical plasma membrane, the solid line separates the apical and subapical actin layer (scale bar, 5 µm). e While rootlets align orthogonally to the plasma membrane (dashed line) at stage 21-22, subapical actin filaments, extending from the tip of the rootlet, connect the rootlets with the plasma membrane at stage 29 (scale bar, 2 µm). f Actin nucleation at the tip of the anterior rootlet coincides with rootlet polarization and orientation along the longitudinal body axis (white arrows). Subapical actin filaments (phalloidin, red) are nucleated from the tip of the rootlet (white arrowheads) (right upper insert; Clamp-GFP, green). The pseudo-colored actin heat map depicts phalloidin signals (white arrowheads), originating at the distal end of rootlets (magenta) (right lower insert) (scale bar, 1 µm). g Rootlets are laterally elongated at stage 29 as compared to stage 20. Representative data of two independent experiments, depicting the results of 12 cells at stage 20, and 5 cells at stage 29. Each circle represents the average length of rootlets in a multiciliated cell (mean ± SD; Mann–Whitney-U test). Source data are provided as a Source Data file. h The diagram explains the apparent elongation of apically imaged (x-y) rootlets after nucleation of subapical actin.

