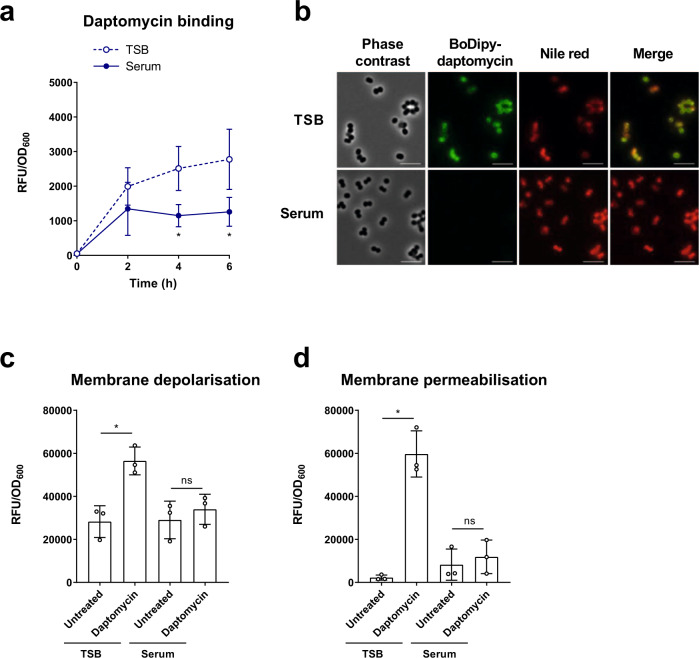
Fig. 2. Daptomycin does not bind to or disrupt the membranes of S. aureus incubated in serum.
Cell-associated fluorescence of TSB-grown and serum-adapted cultures of S. aureus USA300 WT over a 6 h incubation with 320 µg ml−1 BoDipy-daptomycin (a). Cells after 2 h daptomycin exposure from panel (a) were fixed and analysed by phase contrast and fluorescence microscopy (b). Cells were co-stained with 10 µg ml−1 nile red to visualise cell membranes. Scale bars, 5 µm. DiSC3(5) (c) and propidium iodide (d) fluorescence of TSB-grown and serum-adapted cultures after 6 h exposure, or not, to 80 µg ml−1 daptomycin in serum. Fluorescence values were divided by OD600 measurements to normalise for changes in cell density which occurred throughout the assays. Graphs represent the mean ± standard deviation of three independent experiments (NS = not significant (P > 0.05). *For (a), P = 0.0276 (4 h), 0.0132 (6 h). For (c), P = 0.0033 and (d), P < 0.0001). Data in (a) were analysed by two-way ANOVA with Sidak’s post-hoc test (TSB-grown vs serum-adapted at each time-point). Data in (c) and (d) were analysed by two-way ANOVA with Tukey’s post-hoc test (untreated vs daptomycin-exposed). TSB, tryptic soy broth; RFU, relative fluorescence units; OD600, optical density at 600 nm. Source data are provided as a Source Data file.

