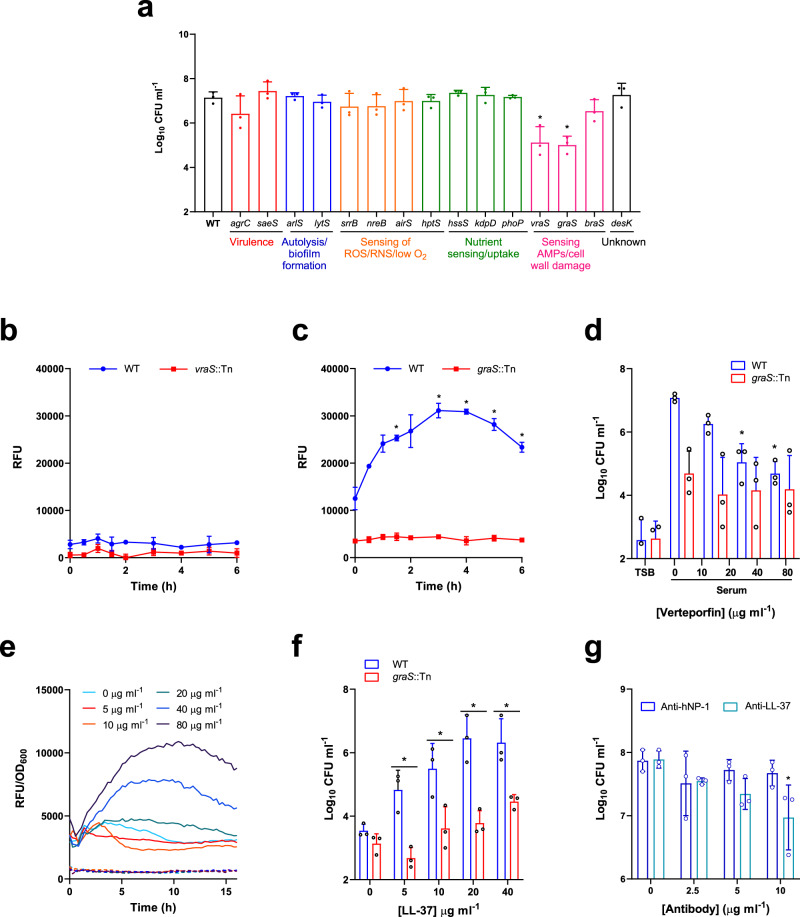
Fig. 3. LL-37 in serum triggers daptomycin tolerance through activation of the GraRS two-component system.
Log10 CFU ml−1 of serum-adapted S. aureus JE2 WT and transposon mutants defective for the sensor components of various TCS after 6 h incubation with 80 μg ml−1 daptomycin (a). GFP fluorescence over a 6 h exposure of TSB-grown S. aureus JE2 WT and the vraS::Tn mutant containing PvraX-gfp (b) or JE2 WT and the graS::Tn mutant containing PdltA-gfp (c) to human serum. Log10 CFU ml−1 after 6 h exposure to 80 μg ml−1 daptomycin of S. aureus JE2 WT and the graS::Tn mutant which had been TSB-grown or pre-incubated for 16 h in serum supplemented with indicated concentrations of verteporfin (d). TSB-grown S. aureus JE2 WT (solid lines) and the graS::Tn mutant (dashed lines) containing PdltA-gfp were exposed to various concentrations of LL-37 (5–80 μg ml−1) in RPMI 1640 and GFP fluorescence (RFU) and OD600 were measured every 15 min for 16 h (e). Fluorescence values were divided by OD600 measurements to normalise for changes in cell density. Log10 CFU ml−1 of WT and graS::Tn mutant strains which had been incubated for 16 h in RPMI 1640 supplemented with indicated concentrations of LL-37 and then exposed to 80 μg ml−1 daptomycin for 6 h (f). Log10 CFU ml−1 of S. aureus JE2 WT incubated for 16 h in serum supplemented with indicated concentrations of antibody targeting hNP-1 or LL-37 and then exposed to 80 μg ml−1 daptomycin for 6 h (g). Graphs in (a), (d), (f) and (g) represent the geometric mean ± geometric standard deviation of three independent experiments. Graphs in (b), (c) and (e) represent the mean ± standard deviation of three independent experiments except panel (e) where error bars have been omitted for clarity. Data in (a) were analysed by one-way ANOVA with Dunnett’s post-hoc test (*P < 0.0001 (vraS), <0.0001 (graS) vs WT). Data in (b) and (c) were analysed by two-way ANOVA with Dunnett’s post-hoc test (* for (c), P = 0.0416 (90 min), 0.0227 (3 h), 0.0491 (4 h), 0.0248 (5 h), 0.0422 (6 h)). Data in (d) and (g) were analysed by two-way ANOVA with Dunnett’s post-hoc test (* for (d), P = 0.01 (40 μg ml−1), 0.0024 (80 μg ml−1); * for (g), P = 0.0044; serum + verteporfin/antibody vs serum alone). Data in (f) were analysed by two-way ANOVA with Sidak’s post-hoc test (*P = 0.0006 (5 μg ml−1), 0.0023 (10 μg ml−1), <0.0001 (20 μg ml−1), 0.0026 (40 μg ml−1). WT vs graS::Tn). RFU, relative fluorescence units; CFU, colony-forming units, OD600, optical density at 600 nm; hNP-1, human neutrophil peptide 1. Source data are provided as a Source Data file.

